Devlab 543848 full analysis,charts,indicators,moving averages,SMA,DMA,EMA,ADX,MACD,RSIDevlab 543848 WideScreen charts, DMA,SMA,EMA technical analysis, forecast prediction, by indicators ADX,MACD,RSI,CCI BSE stock exchange
Daily price and charts and targets Devlab Strong Daily Stock price targets for Devlab 543848 are 60 and 60 | Daily Target 1 | 60 | | Daily Target 2 | 60 | | Daily Target 3 | 60 | | Daily Target 4 | 60 | | Daily Target 5 | 60 |
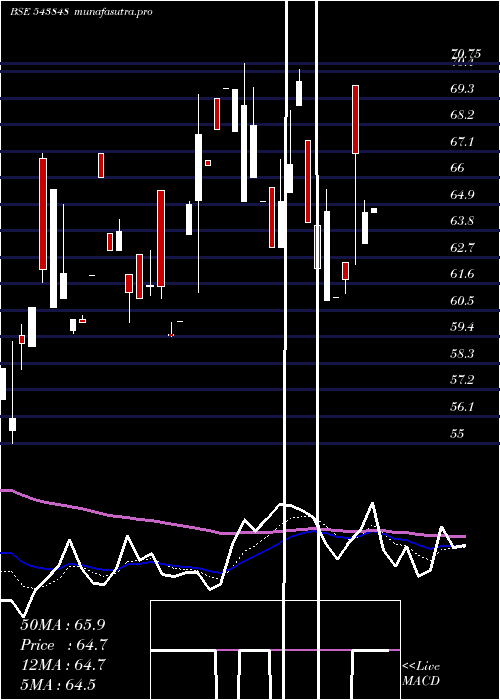
Daily price and volume Devlab
| Date |
Closing |
Open |
Range |
Volume |
Tue 21 October 2025 |
60.00 (-4%) |
60.00 |
60.00 - 60.00 |
0.0735 times |
Mon 20 October 2025 |
62.50 (0.32%) |
62.01 |
62.01 - 63.40 |
2.2059 times |
Fri 17 October 2025 |
62.30 (0.44%) |
63.79 |
62.28 - 63.79 |
1.8382 times |
Thu 16 October 2025 |
62.03 (0.53%) |
62.03 |
62.03 - 62.03 |
1.6176 times |
Wed 15 October 2025 |
61.70 (-1.67%) |
61.50 |
61.50 - 61.70 |
0.6618 times |
Mon 13 October 2025 |
62.75 (-0.57%) |
62.25 |
62.25 - 62.75 |
1.3235 times |
Tue 07 October 2025 |
63.11 (4.99%) |
60.25 |
60.25 - 63.11 |
1.25 times |
Mon 06 October 2025 |
60.11 (-3.36%) |
60.11 |
60.11 - 60.11 |
0.7353 times |
Fri 03 October 2025 |
62.20 (-2.81%) |
62.20 |
62.20 - 62.20 |
0.2206 times |
Mon 29 September 2025 |
64.00 (-3.59%) |
64.00 |
64.00 - 64.00 |
0.0735 times |
Fri 26 September 2025 |
66.38 (3.54%) |
61.60 |
61.60 - 66.38 |
1.3235 times |
Weekly price and charts Devlab Strong weekly Stock price targets for Devlab 543848 are 58.3 and 61.7 | Weekly Target 1 | 57.73 | | Weekly Target 2 | 58.87 | | Weekly Target 3 | 61.133333333333 | | Weekly Target 4 | 62.27 | | Weekly Target 5 | 64.53 |
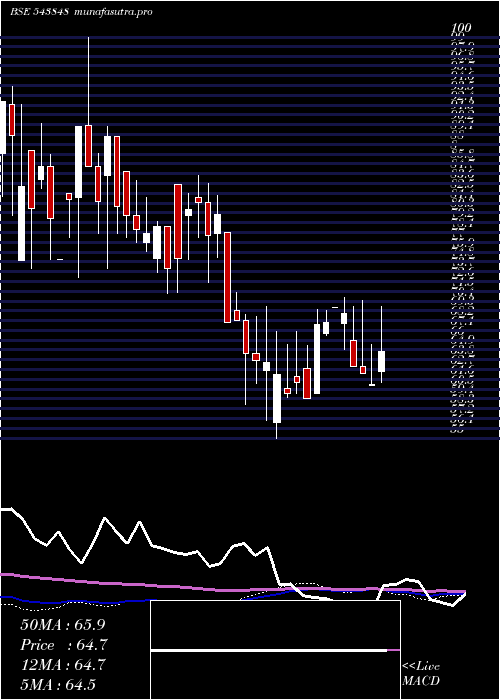
Weekly price and volumes for Devlab
| Date |
Closing |
Open |
Range |
Volume |
Tue 21 October 2025 |
60.00 (-3.69%) |
62.01 |
60.00 - 63.40 |
1.3964 times |
Fri 17 October 2025 |
62.30 (-1.28%) |
62.25 |
61.50 - 63.79 |
3.3333 times |
Tue 07 October 2025 |
63.11 (1.46%) |
60.11 |
60.11 - 63.11 |
1.2162 times |
Fri 03 October 2025 |
62.20 (-6.3%) |
64.00 |
62.20 - 64.00 |
0.1802 times |
Fri 26 September 2025 |
66.38 (0.58%) |
68.64 |
61.60 - 68.64 |
0.991 times |
Fri 12 September 2025 |
66.00 (-4.26%) |
67.50 |
64.75 - 67.50 |
0.4955 times |
Fri 05 September 2025 |
68.94 (-2.02%) |
67.05 |
65.66 - 69.40 |
0.3604 times |
Thu 28 August 2025 |
70.36 (5.01%) |
64.11 |
64.11 - 70.36 |
0.4955 times |
Wed 20 August 2025 |
67.00 (-2.32%) |
65.50 |
64.00 - 67.00 |
0.5856 times |
Thu 14 August 2025 |
68.59 (-12.06%) |
74.50 |
68.59 - 80.00 |
0.9459 times |
Thu 07 August 2025 |
78.00 (0%) |
80.00 |
78.00 - 81.00 |
0.1351 times |
Monthly price and charts Devlab Strong monthly Stock price targets for Devlab 543848 are 58.11 and 61.9 | Monthly Target 1 | 57.47 | | Monthly Target 2 | 58.74 | | Monthly Target 3 | 61.263333333333 | | Monthly Target 4 | 62.53 | | Monthly Target 5 | 65.05 |
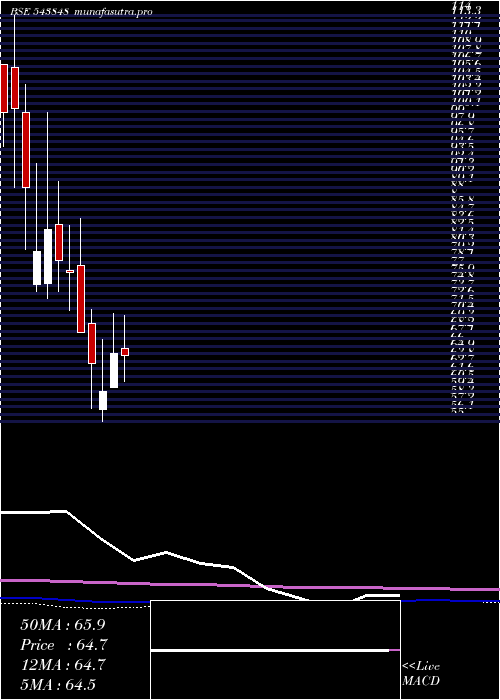
Monthly price and volumes Devlab
| Date |
Closing |
Open |
Range |
Volume |
Tue 21 October 2025 |
60.00 (-6.25%) |
62.20 |
60.00 - 63.79 |
0.5073 times |
Mon 29 September 2025 |
64.00 (-9.04%) |
67.05 |
61.60 - 69.40 |
0.1578 times |
Thu 28 August 2025 |
70.36 (-7.12%) |
73.90 |
64.00 - 81.00 |
0.2142 times |
Wed 30 July 2025 |
75.75 (24.3%) |
60.72 |
60.65 - 94.00 |
1.3454 times |
Mon 30 June 2025 |
60.94 (-1.79%) |
69.40 |
57.10 - 69.40 |
2.5742 times |
Fri 30 May 2025 |
62.05 (-4.54%) |
65.60 |
51.99 - 70.50 |
1.0973 times |
Tue 29 April 2025 |
65.00 (9.32%) |
60.02 |
60.02 - 70.75 |
0.124 times |
Fri 28 March 2025 |
59.46 (-6.36%) |
56.80 |
55.00 - 67.00 |
1.5859 times |
Fri 28 February 2025 |
63.50 (-6.66%) |
69.32 |
57.00 - 71.40 |
1.3115 times |
Thu 30 January 2025 |
68.03 (-11.4%) |
77.79 |
68.00 - 84.50 |
1.0823 times |
Tue 31 December 2024 |
76.78 (-2.1%) |
77.00 |
71.20 - 83.50 |
1.7625 times |
DMA SMA EMA moving averages of Devlab 543848
DMA (daily moving average) of Devlab 543848
| DMA period | DMA value | | 5 day DMA | 61.71 | | 12 day DMA | 62.6 | | 20 day DMA | 64.3 | | 35 day DMA | 68.04 | | 50 day DMA | 70.36 | | 100 day DMA | 67.05 | | 150 day DMA | 67.09 | | 200 day DMA | 70.37 | EMA (exponential moving average) of Devlab 543848
| EMA period | EMA current | EMA prev | EMA prev2 | | 5 day EMA | 61.59 | 62.39 | 62.33 | | 12 day EMA | 62.83 | 63.35 | 63.5 | | 20 day EMA | 64.25 | 64.7 | 64.93 | | 35 day EMA | 66.5 | 66.88 | 67.14 | | 50 day EMA | 68.86 | 69.22 | 69.49 |
SMA (simple moving average) of Devlab 543848
| SMA period | SMA current | SMA prev | SMA prev2 | | 5 day SMA | 61.71 | 62.26 | 62.38 | | 12 day SMA | 62.6 | 63.1 | 63.61 | | 20 day SMA | 64.3 | 64.77 | 65 | | 35 day SMA | 68.04 | 68.54 | 68.94 | | 50 day SMA | 70.36 | 70.46 | 70.46 | | 100 day SMA | 67.05 | 67.05 | 67.02 | | 150 day SMA | 67.09 | 67.23 | 67.35 | | 200 day SMA | 70.37 | 70.52 | 70.65 |
|
|
