Bright 543831 full analysis,charts,indicators,moving averages,SMA,DMA,EMA,ADX,MACD,RSIBright 543831 WideScreen charts, DMA,SMA,EMA technical analysis, forecast prediction, by indicators ADX,MACD,RSI,CCI BSE stock exchange
Daily price and charts and targets Bright Strong Daily Stock price targets for Bright 543831 are 376.5 and 393.5 | Daily Target 1 | 373.67 | | Daily Target 2 | 379.33 | | Daily Target 3 | 390.66666666667 | | Daily Target 4 | 396.33 | | Daily Target 5 | 407.67 |
Daily price and volume Bright
| Date |
Closing |
Open |
Range |
Volume |
Thu 23 October 2025 |
385.00 (-0.39%) |
402.00 |
385.00 - 402.00 |
0.1268 times |
Tue 21 October 2025 |
386.50 (-0.9%) |
391.00 |
381.30 - 391.00 |
0.148 times |
Mon 20 October 2025 |
390.00 (1.04%) |
398.00 |
390.00 - 398.00 |
0.0846 times |
Fri 17 October 2025 |
386.00 (-1.2%) |
402.00 |
383.35 - 418.95 |
0.9091 times |
Thu 16 October 2025 |
390.70 (18.66%) |
336.00 |
336.00 - 395.10 |
5.0529 times |
Wed 15 October 2025 |
329.25 (-4.57%) |
345.55 |
310.05 - 350.00 |
2.7061 times |
Tue 14 October 2025 |
345.00 (-1.68%) |
345.00 |
345.00 - 345.00 |
0.0211 times |
Mon 13 October 2025 |
350.90 (0.52%) |
349.20 |
349.20 - 350.90 |
0.0423 times |
Fri 10 October 2025 |
349.10 (0.52%) |
348.50 |
345.00 - 350.00 |
0.6554 times |
Thu 09 October 2025 |
347.30 (0.67%) |
336.20 |
336.00 - 349.00 |
0.2537 times |
Wed 08 October 2025 |
345.00 (2.25%) |
344.00 |
344.00 - 345.00 |
0.148 times |
Weekly price and charts Bright Strong weekly Stock price targets for Bright 543831 are 372.8 and 393.5 | Weekly Target 1 | 368.73 | | Weekly Target 2 | 376.87 | | Weekly Target 3 | 389.43333333333 | | Weekly Target 4 | 397.57 | | Weekly Target 5 | 410.13 |
Weekly price and volumes for Bright
| Date |
Closing |
Open |
Range |
Volume |
Thu 23 October 2025 |
385.00 (-0.26%) |
398.00 |
381.30 - 402.00 |
0.1778 times |
Fri 17 October 2025 |
386.00 (10.57%) |
349.20 |
310.05 - 418.95 |
4.3201 times |
Fri 10 October 2025 |
349.10 (-0.26%) |
341.60 |
336.00 - 350.00 |
0.6276 times |
Fri 03 October 2025 |
350.00 (4.23%) |
336.80 |
332.10 - 350.00 |
0.6381 times |
Fri 26 September 2025 |
335.80 (-3.23%) |
349.00 |
335.00 - 355.70 |
1.3075 times |
Fri 19 September 2025 |
347.00 (2.12%) |
344.25 |
327.00 - 349.00 |
0.8996 times |
Fri 12 September 2025 |
339.80 (-0.06%) |
332.55 |
329.00 - 340.00 |
0.2406 times |
Fri 05 September 2025 |
340.00 (5.46%) |
333.80 |
333.00 - 350.00 |
0.9623 times |
Fri 29 August 2025 |
322.40 (-6.86%) |
350.00 |
317.65 - 350.00 |
0.272 times |
Fri 22 August 2025 |
346.15 (-3.77%) |
351.90 |
342.05 - 361.80 |
0.5544 times |
Thu 14 August 2025 |
359.70 (2.32%) |
355.00 |
350.10 - 372.90 |
0.9833 times |
Monthly price and charts Bright Strong monthly Stock price targets for Bright 543831 are 347.53 and 456.43 | Monthly Target 1 | 262.43 | | Monthly Target 2 | 323.72 | | Monthly Target 3 | 371.33333333333 | | Monthly Target 4 | 432.62 | | Monthly Target 5 | 480.23 |
Monthly price and volumes Bright
| Date |
Closing |
Open |
Range |
Volume |
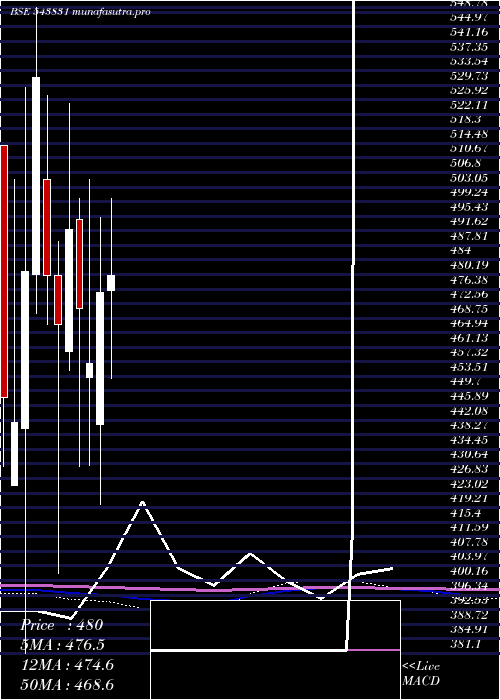
Thu 23 October 2025 |
385.00 (14.45%) |
333.25 |
310.05 - 418.95 |
1.4574 times |
Tue 30 September 2025 |
336.40 (4.34%) |
333.80 |
327.00 - 355.70 |
0.875 times |
Fri 29 August 2025 |
322.40 (-13.74%) |
377.90 |
317.65 - 390.00 |
0.6941 times |
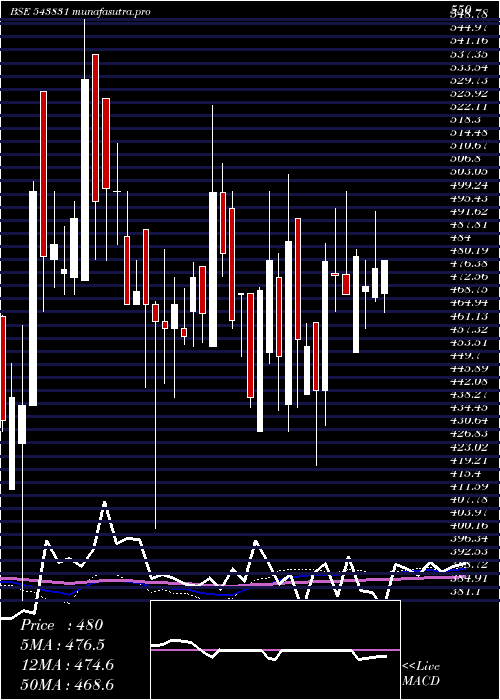
Thu 31 July 2025 |
373.75 (-33.43%) |
555.55 |
370.00 - 594.50 |
0.5869 times |
Mon 30 June 2025 |
561.40 (-1.28%) |
555.00 |
542.00 - 598.00 |
0.867 times |
Fri 30 May 2025 |
568.70 (18.48%) |
484.90 |
480.00 - 619.90 |
2.3972 times |
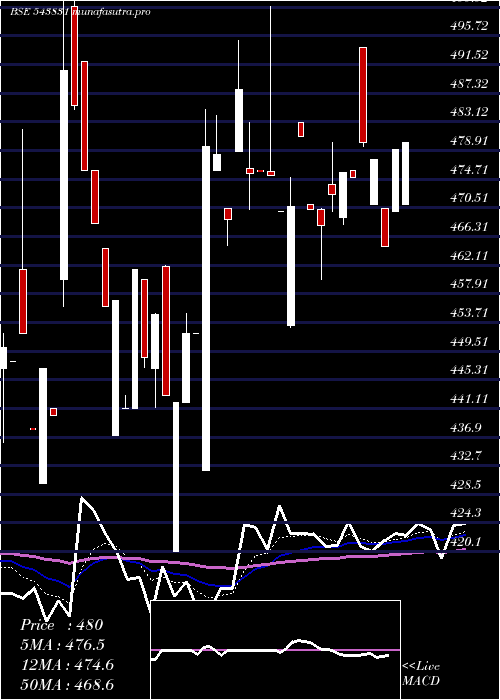
Wed 30 April 2025 |
480.00 (0.95%) |
475.95 |
453.00 - 500.00 |
2.1897 times |
Fri 28 March 2025 |
475.50 (4.08%) |
441.00 |
420.10 - 495.00 |
0.4255 times |
Fri 28 February 2025 |
456.85 (-3.05%) |
453.10 |
430.10 - 505.00 |
0.2996 times |
Fri 31 January 2025 |
471.20 (-4.21%) |
494.60 |
430.00 - 500.00 |
0.2074 times |
Tue 31 December 2024 |
491.90 (5.33%) |
460.00 |
455.00 - 525.00 |
0.7465 times |
DMA SMA EMA moving averages of Bright 543831
DMA (daily moving average) of Bright 543831
| DMA period | DMA value | | 5 day DMA | 387.64 | | 12 day DMA | 361.85 | | 20 day DMA | 354.06 | | 35 day DMA | 347.31 | | 50 day DMA | 348.48 | | 100 day DMA | 436.43 | | 150 day DMA | 448.89 | | 200 day DMA | 453.54 | EMA (exponential moving average) of Bright 543831
| EMA period | EMA current | EMA prev | EMA prev2 | | 5 day EMA | 380.72 | 378.58 | 374.62 | | 12 day EMA | 367.72 | 364.58 | 360.6 | | 20 day EMA | 360.32 | 357.72 | 354.69 | | 35 day EMA | 355.82 | 354.1 | 352.19 | | 50 day EMA | 354.44 | 353.19 | 351.83 |
SMA (simple moving average) of Bright 543831
| SMA period | SMA current | SMA prev | SMA prev2 | | 5 day SMA | 387.64 | 376.49 | 368.19 | | 12 day SMA | 361.85 | 358.93 | 354.4 | | 20 day SMA | 354.06 | 352.25 | 350.27 | | 35 day SMA | 347.31 | 345.65 | 344.23 | | 50 day SMA | 348.48 | 348.12 | 347.84 | | 100 day SMA | 436.43 | 437.58 | 438.72 | | 150 day SMA | 448.89 | 449.34 | 449.75 | | 200 day SMA | 453.54 | 453.95 | 454.3 |
|
|
