Harsha 543600 full analysis,charts,indicators,moving averages,SMA,DMA,EMA,ADX,MACD,RSIHarsha 543600 WideScreen charts, DMA,SMA,EMA technical analysis, forecast prediction, by indicators ADX,MACD,RSI,CCI BSE stock exchange
Daily price and charts and targets Harsha Strong Daily Stock price targets for Harsha 543600 are 402.08 and 409.28 | Daily Target 1 | 396.48 | | Daily Target 2 | 400.47 | | Daily Target 3 | 403.68333333333 | | Daily Target 4 | 407.67 | | Daily Target 5 | 410.88 |
Daily price and volume Harsha
| Date |
Closing |
Open |
Range |
Volume |
Tue 02 September 2025 |
404.45 (0.78%) |
401.30 |
399.70 - 406.90 |
1.7487 times |
Mon 01 September 2025 |
401.30 (1.07%) |
395.05 |
395.05 - 403.00 |
1.2227 times |
Fri 29 August 2025 |
397.05 (-1.08%) |
401.45 |
396.10 - 408.30 |
1.2204 times |
Thu 28 August 2025 |
401.40 (-1.53%) |
407.00 |
399.35 - 412.05 |
1.1643 times |
Tue 26 August 2025 |
407.65 (-1.4%) |
412.70 |
405.00 - 413.00 |
0.2365 times |
Mon 25 August 2025 |
413.45 (0.38%) |
411.90 |
410.75 - 415.00 |
0.6102 times |
Fri 22 August 2025 |
411.90 (-0.75%) |
414.60 |
411.10 - 415.75 |
0.2212 times |
Thu 21 August 2025 |
415.00 (0.45%) |
425.00 |
413.30 - 425.00 |
0.5905 times |
Wed 20 August 2025 |
413.15 (-0.3%) |
416.00 |
411.65 - 419.30 |
0.7984 times |
Tue 19 August 2025 |
414.40 (1.33%) |
412.40 |
409.40 - 417.30 |
2.1873 times |
Mon 18 August 2025 |
408.95 (0.2%) |
415.00 |
407.75 - 415.00 |
0.5962 times |

Weekly price and charts Harsha Strong weekly Stock price targets for Harsha 543600 are 399.75 and 411.6 | Weekly Target 1 | 390.28 | | Weekly Target 2 | 397.37 | | Weekly Target 3 | 402.13333333333 | | Weekly Target 4 | 409.22 | | Weekly Target 5 | 413.98 |
Weekly price and volumes for Harsha
| Date |
Closing |
Open |
Range |
Volume |
Tue 02 September 2025 |
404.45 (1.86%) |
395.05 |
395.05 - 406.90 |
0.1427 times |
Fri 29 August 2025 |
397.05 (-3.61%) |
411.90 |
396.10 - 415.00 |
0.1552 times |
Fri 22 August 2025 |
411.90 (0.92%) |
415.00 |
407.75 - 425.00 |
0.211 times |
Thu 14 August 2025 |
408.15 (-1.71%) |
420.00 |
405.50 - 420.00 |
5.3935 times |
Fri 08 August 2025 |
415.25 (1.89%) |
421.85 |
410.00 - 436.90 |
0.5 times |
Fri 01 August 2025 |
407.55 (-0.52%) |
425.90 |
405.95 - 434.90 |
0.7664 times |
Fri 25 July 2025 |
409.70 (-0.23%) |
411.00 |
402.15 - 427.00 |
1.1764 times |
Fri 18 July 2025 |
410.65 (0.33%) |
411.60 |
406.75 - 433.80 |
0.659 times |
Fri 11 July 2025 |
409.30 (0.58%) |
407.15 |
390.00 - 414.00 |
0.4345 times |
Fri 04 July 2025 |
406.95 (-1.62%) |
388.25 |
388.25 - 427.00 |
0.5612 times |
Fri 27 June 2025 |
413.65 (7.75%) |
376.05 |
376.05 - 416.85 |
0.9532 times |
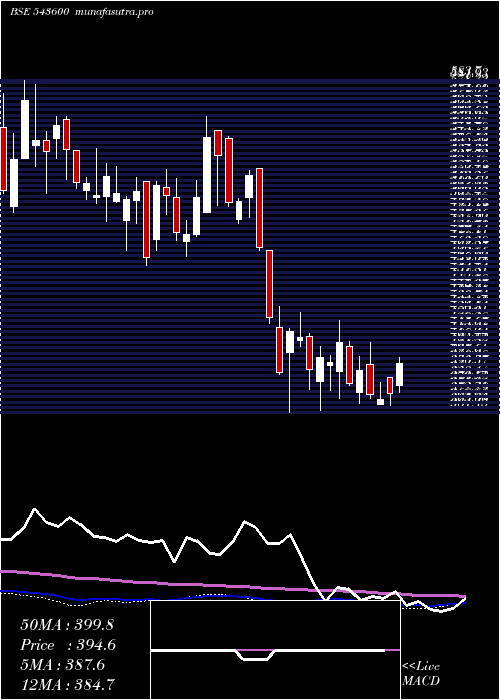
Monthly price and charts Harsha Strong monthly Stock price targets for Harsha 543600 are 399.75 and 411.6 | Monthly Target 1 | 390.28 | | Monthly Target 2 | 397.37 | | Monthly Target 3 | 402.13333333333 | | Monthly Target 4 | 409.22 | | Monthly Target 5 | 413.98 |
Monthly price and volumes Harsha
| Date |
Closing |
Open |
Range |
Volume |
Tue 02 September 2025 |
404.45 (1.86%) |
395.05 |
395.05 - 406.90 |
0.0119 times |
Fri 29 August 2025 |
397.05 (-4.26%) |
413.40 |
396.10 - 436.90 |
0.5243 times |
Thu 31 July 2025 |
414.70 (-2.25%) |
427.00 |
390.00 - 434.90 |
0.2697 times |
Mon 30 June 2025 |
424.25 (7.71%) |
399.90 |
376.05 - 451.00 |
5.5178 times |
Fri 30 May 2025 |
393.90 (4.83%) |
383.30 |
350.00 - 407.00 |
1.0569 times |
Wed 30 April 2025 |
375.75 (0.54%) |
367.05 |
366.40 - 406.30 |
0.0767 times |
Fri 28 March 2025 |
373.75 (-5.34%) |
389.00 |
368.00 - 423.40 |
0.7597 times |
Fri 28 February 2025 |
394.85 (-5.1%) |
410.05 |
363.40 - 428.55 |
0.1076 times |
Fri 31 January 2025 |
416.05 (-16.36%) |
497.00 |
361.45 - 524.40 |
0.1973 times |
Tue 31 December 2024 |
497.45 (-1.53%) |
495.05 |
488.05 - 559.40 |
1.4782 times |
Fri 29 November 2024 |
505.20 (0.09%) |
509.55 |
466.05 - 523.80 |
0.1228 times |
DMA SMA EMA moving averages of Harsha 543600
DMA (daily moving average) of Harsha 543600
| DMA period | DMA value | | 5 day DMA | 402.37 | | 12 day DMA | 408.07 | | 20 day DMA | 410.83 | | 35 day DMA | 411.19 | | 50 day DMA | 409.5 | | 100 day DMA | 398.25 | | 150 day DMA | 397.58 | | 200 day DMA | 423.35 | EMA (exponential moving average) of Harsha 543600
| EMA period | EMA current | EMA prev | EMA prev2 | | 5 day EMA | 403.68 | 403.3 | 404.3 | | 12 day EMA | 406.83 | 407.26 | 408.34 | | 20 day EMA | 408.35 | 408.76 | 409.55 | | 35 day EMA | 408.07 | 408.28 | 408.69 | | 50 day EMA | 406.95 | 407.05 | 407.28 |
SMA (simple moving average) of Harsha 543600
| SMA period | SMA current | SMA prev | SMA prev2 | | 5 day SMA | 402.37 | 404.17 | 406.29 | | 12 day SMA | 408.07 | 408.61 | 409.19 | | 20 day SMA | 410.83 | 410.99 | 411.66 | | 35 day SMA | 411.19 | 411.33 | 411.66 | | 50 day SMA | 409.5 | 409.09 | 408.82 | | 100 day SMA | 398.25 | 397.97 | 397.69 | | 150 day SMA | 397.58 | 397.73 | 397.93 | | 200 day SMA | 423.35 | 423.89 | 424.41 |
|
|
