Hdfcnext50 543570 full analysis,charts,indicators,moving averages,SMA,DMA,EMA,ADX,MACD,RSIHdfcnext50 543570 WideScreen charts, DMA,SMA,EMA technical analysis, forecast prediction, by indicators ADX,MACD,RSI,CCI BSE stock exchange
Daily price and charts and targets Hdfcnext50 Strong Daily Stock price targets for Hdfcnext50 543570 are 70.5 and 72.36 | Daily Target 1 | 69.16 | | Daily Target 2 | 69.98 | | Daily Target 3 | 71.02 | | Daily Target 4 | 71.84 | | Daily Target 5 | 72.88 |
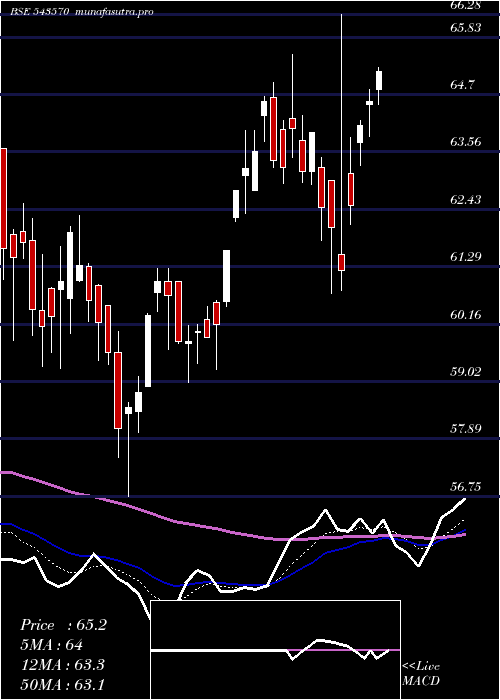
Daily price and volume Hdfcnext50
| Date |
Closing |
Open |
Range |
Volume |
Tue 21 October 2025 |
70.80 (0.74%) |
70.52 |
70.20 - 72.06 |
0.6923 times |
Mon 20 October 2025 |
70.28 (0.41%) |
70.38 |
70.28 - 70.81 |
1.7333 times |
Fri 17 October 2025 |
69.99 (-0.75%) |
70.52 |
69.87 - 70.73 |
0.2561 times |
Thu 16 October 2025 |
70.52 (0.73%) |
70.21 |
70.08 - 70.55 |
0.476 times |
Wed 15 October 2025 |
70.01 (0.69%) |
69.56 |
69.03 - 70.22 |
0.7942 times |
Tue 14 October 2025 |
69.53 (-0.34%) |
69.18 |
69.06 - 69.91 |
2.6835 times |
Mon 13 October 2025 |
69.77 (0.24%) |
69.30 |
68.97 - 69.88 |
1.5934 times |
Fri 10 October 2025 |
69.60 (0.29%) |
70.08 |
69.60 - 70.59 |
0.3915 times |
Thu 09 October 2025 |
69.40 (0.25%) |
69.22 |
69.18 - 69.56 |
0.9453 times |
Wed 08 October 2025 |
69.23 (-0.53%) |
69.79 |
69.12 - 69.79 |
0.4344 times |
Tue 07 October 2025 |
69.60 (-0.03%) |
69.84 |
69.53 - 69.96 |
2.4707 times |
Weekly price and charts Hdfcnext50 Strong weekly Stock price targets for Hdfcnext50 543570 are 70.5 and 72.36 | Weekly Target 1 | 69.16 | | Weekly Target 2 | 69.98 | | Weekly Target 3 | 71.02 | | Weekly Target 4 | 71.84 | | Weekly Target 5 | 72.88 |
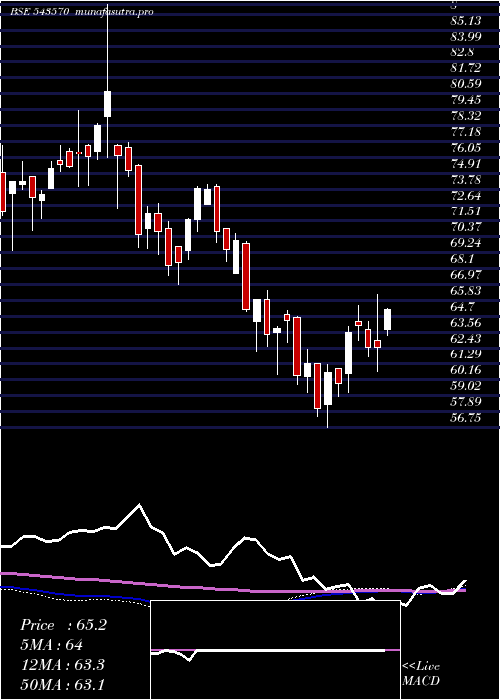
Weekly price and volumes for Hdfcnext50
| Date |
Closing |
Open |
Range |
Volume |
Tue 21 October 2025 |
70.80 (1.16%) |
70.38 |
70.20 - 72.06 |
0.1253 times |
Fri 17 October 2025 |
69.99 (0.56%) |
69.30 |
68.97 - 70.73 |
0.2998 times |
Fri 10 October 2025 |
69.60 (0.32%) |
69.29 |
69.09 - 70.59 |
0.4402 times |
Fri 03 October 2025 |
69.38 (0.83%) |
68.53 |
68.45 - 69.95 |
1.1534 times |
Fri 26 September 2025 |
68.81 (-3.02%) |
70.95 |
68.30 - 71.50 |
2.546 times |
Fri 19 September 2025 |
70.95 (2.15%) |
68.97 |
68.81 - 70.95 |
1.5647 times |
Fri 12 September 2025 |
69.46 (1.55%) |
68.95 |
68.09 - 69.64 |
1.2945 times |
Fri 05 September 2025 |
68.40 (2.06%) |
67.21 |
67.02 - 69.15 |
0.7094 times |
Fri 29 August 2025 |
67.02 (-2.6%) |
69.00 |
66.75 - 69.99 |
1.1064 times |
Fri 22 August 2025 |
68.81 (1.74%) |
68.40 |
68.11 - 69.84 |
0.7603 times |
Thu 14 August 2025 |
67.63 (1.38%) |
66.76 |
66.56 - 68.03 |
0.7072 times |
Monthly price and charts Hdfcnext50 Strong monthly Stock price targets for Hdfcnext50 543570 are 69.85 and 73.02 | Monthly Target 1 | 67.41 | | Monthly Target 2 | 69.11 | | Monthly Target 3 | 70.583333333333 | | Monthly Target 4 | 72.28 | | Monthly Target 5 | 73.75 |
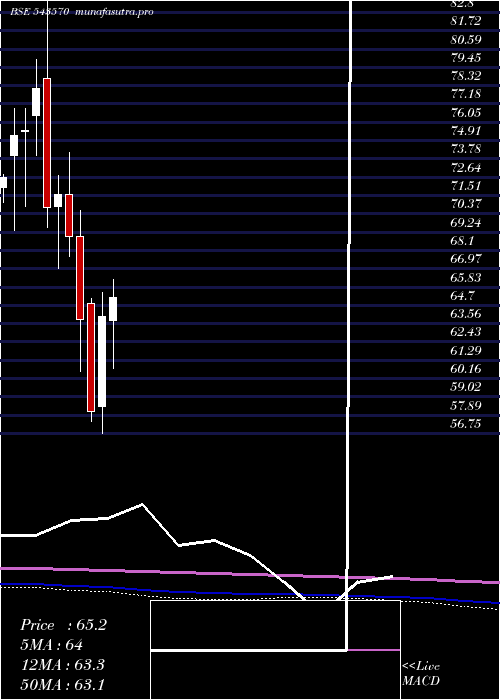
Monthly price and volumes Hdfcnext50
| Date |
Closing |
Open |
Range |
Volume |
Tue 21 October 2025 |
70.80 (2.77%) |
68.89 |
68.89 - 72.06 |
0.2077 times |
Tue 30 September 2025 |
68.89 (2.79%) |
67.21 |
67.02 - 71.50 |
1.3425 times |
Fri 29 August 2025 |
67.02 (-1.73%) |
68.42 |
66.43 - 69.99 |
0.739 times |
Thu 31 July 2025 |
68.20 (-2.39%) |
69.25 |
67.34 - 70.60 |
0.7715 times |
Mon 30 June 2025 |
69.87 (2.98%) |
67.65 |
66.66 - 70.39 |
1.1069 times |
Fri 30 May 2025 |
67.85 (3.62%) |
65.58 |
62.05 - 68.60 |
0.9966 times |
Wed 30 April 2025 |
65.48 (2.28%) |
63.78 |
60.75 - 66.99 |
0.9814 times |
Fri 28 March 2025 |
64.02 (10.23%) |
58.39 |
56.75 - 65.48 |
1.2784 times |
Fri 28 February 2025 |
58.08 (-8.99%) |
64.79 |
57.51 - 65.14 |
1.1033 times |
Fri 31 January 2025 |
63.82 (-7.45%) |
68.95 |
60.57 - 70.60 |
1.4728 times |
Tue 31 December 2024 |
68.96 (-3.67%) |
71.59 |
67.72 - 74.14 |
0.6371 times |
DMA SMA EMA moving averages of Hdfcnext50 543570
DMA (daily moving average) of Hdfcnext50 543570
| DMA period | DMA value | | 5 day DMA | 70.32 | | 12 day DMA | 69.86 | | 20 day DMA | 69.72 | | 35 day DMA | 69.57 | | 50 day DMA | 69.12 | | 100 day DMA | 68.89 | | 150 day DMA | 67.4 | | 200 day DMA | 66.55 | EMA (exponential moving average) of Hdfcnext50 543570
| EMA period | EMA current | EMA prev | EMA prev2 | | 5 day EMA | 70.32 | 70.08 | 69.98 | | 12 day EMA | 70 | 69.86 | 69.78 | | 20 day EMA | 69.82 | 69.72 | 69.66 | | 35 day EMA | 69.42 | 69.34 | 69.28 | | 50 day EMA | 69.12 | 69.05 | 69 |
SMA (simple moving average) of Hdfcnext50 543570
| SMA period | SMA current | SMA prev | SMA prev2 | | 5 day SMA | 70.32 | 70.07 | 69.96 | | 12 day SMA | 69.86 | 69.74 | 69.67 | | 20 day SMA | 69.72 | 69.73 | 69.76 | | 35 day SMA | 69.57 | 69.48 | 69.39 | | 50 day SMA | 69.12 | 69.06 | 69 | | 100 day SMA | 68.89 | 68.85 | 68.83 | | 150 day SMA | 67.4 | 67.33 | 67.26 | | 200 day SMA | 66.55 | 66.54 | 66.55 |
|
|
