Softtech 543470 full analysis,charts,indicators,moving averages,SMA,DMA,EMA,ADX,MACD,RSISofttech 543470 WideScreen charts, DMA,SMA,EMA technical analysis, forecast prediction, by indicators ADX,MACD,RSI,CCI BSE stock exchange
Daily price and charts and targets Softtech Strong Daily Stock price targets for Softtech 543470 are 366.63 and 373.28 | Daily Target 1 | 364.93 | | Daily Target 2 | 368.32 | | Daily Target 3 | 371.58333333333 | | Daily Target 4 | 374.97 | | Daily Target 5 | 378.23 |
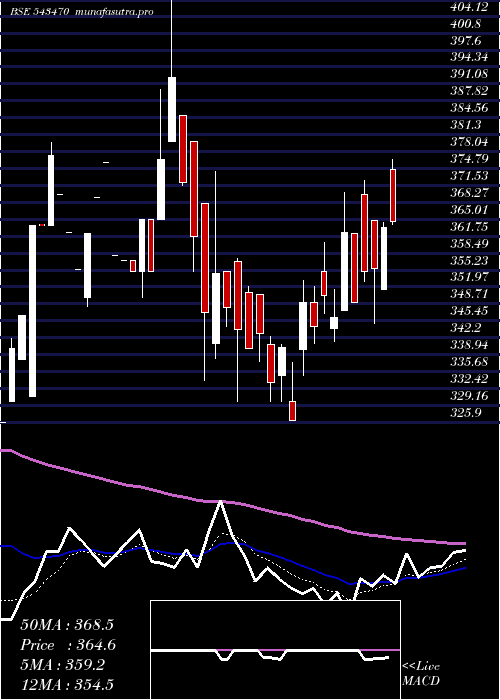
Daily price and volume Softtech
| Date |
Closing |
Open |
Range |
Volume |
Thu 23 October 2025 |
371.70 (-2.16%) |
374.85 |
368.20 - 374.85 |
1.2228 times |
Tue 21 October 2025 |
379.90 (5%) |
383.80 |
373.50 - 384.60 |
0.0419 times |
Mon 20 October 2025 |
361.80 (1.08%) |
357.95 |
357.95 - 361.80 |
0.0251 times |
Fri 17 October 2025 |
357.95 (-1.92%) |
368.40 |
357.95 - 371.35 |
0.2094 times |
Thu 16 October 2025 |
364.95 (-2.54%) |
379.20 |
357.95 - 379.20 |
0.5863 times |
Wed 15 October 2025 |
374.45 (1.6%) |
378.50 |
372.95 - 378.50 |
0.0503 times |
Tue 14 October 2025 |
368.55 (-0.82%) |
384.00 |
368.55 - 384.00 |
0.9715 times |
Mon 13 October 2025 |
371.60 (-4.31%) |
383.35 |
370.65 - 384.15 |
2.3199 times |
Fri 10 October 2025 |
388.35 (3.09%) |
386.75 |
375.00 - 389.00 |
4.2379 times |
Thu 09 October 2025 |
376.70 (0.45%) |
379.55 |
376.70 - 380.00 |
0.335 times |
Wed 08 October 2025 |
375.00 (1.71%) |
370.35 |
370.35 - 378.85 |
0.2848 times |
Weekly price and charts Softtech Strong weekly Stock price targets for Softtech 543470 are 364.83 and 391.48 | Weekly Target 1 | 344.77 | | Weekly Target 2 | 358.23 | | Weekly Target 3 | 371.41666666667 | | Weekly Target 4 | 384.88 | | Weekly Target 5 | 398.07 |
Weekly price and volumes for Softtech
| Date |
Closing |
Open |
Range |
Volume |
Thu 23 October 2025 |
371.70 (3.84%) |
357.95 |
357.95 - 384.60 |
0.0925 times |
Fri 17 October 2025 |
357.95 (-7.83%) |
383.35 |
357.95 - 384.15 |
0.2968 times |
Fri 10 October 2025 |
388.35 (4.03%) |
375.15 |
368.70 - 389.00 |
0.6333 times |
Fri 03 October 2025 |
373.30 (-0.33%) |
379.35 |
355.00 - 379.35 |
0.0733 times |
Fri 26 September 2025 |
374.55 (0.98%) |
377.50 |
348.00 - 384.25 |
1.1231 times |
Fri 19 September 2025 |
370.90 (-3.79%) |
390.40 |
369.35 - 392.80 |
0.8701 times |
Fri 12 September 2025 |
385.50 (-2%) |
390.10 |
379.65 - 419.85 |
1.8886 times |
Fri 05 September 2025 |
393.35 (1.48%) |
394.45 |
381.00 - 403.75 |
0.9927 times |
Fri 29 August 2025 |
387.60 (-2.22%) |
398.55 |
377.40 - 398.55 |
0.8635 times |
Fri 22 August 2025 |
396.40 (7.14%) |
377.95 |
362.60 - 409.45 |
3.1661 times |
Thu 14 August 2025 |
370.00 (-1.65%) |
384.60 |
365.00 - 384.60 |
0.0823 times |

Monthly price and charts Softtech Strong monthly Stock price targets for Softtech 543470 are 364.83 and 395.88 | Monthly Target 1 | 341.83 | | Monthly Target 2 | 356.77 | | Monthly Target 3 | 372.88333333333 | | Monthly Target 4 | 387.82 | | Monthly Target 5 | 403.93 |
Monthly price and volumes Softtech
| Date |
Closing |
Open |
Range |
Volume |
Thu 23 October 2025 |
371.70 (0.68%) |
367.50 |
357.95 - 389.00 |
0.0753 times |
Tue 30 September 2025 |
369.20 (-4.75%) |
394.45 |
348.00 - 419.85 |
0.3515 times |
Fri 29 August 2025 |
387.60 (5.21%) |
370.35 |
361.80 - 409.45 |
0.6651 times |
Thu 31 July 2025 |
368.40 (-3.95%) |
388.65 |
351.10 - 418.00 |
1.8192 times |
Mon 30 June 2025 |
383.55 (10.66%) |
352.40 |
310.70 - 388.50 |
3.2265 times |
Fri 30 May 2025 |
346.60 (-0.4%) |
356.95 |
326.25 - 401.00 |
1.5388 times |
Wed 30 April 2025 |
348.00 (-5.74%) |
375.95 |
334.00 - 414.05 |
1.6091 times |
Fri 28 March 2025 |
369.20 (-2.15%) |
369.80 |
348.15 - 369.80 |
0.0407 times |
Fri 28 February 2025 |
377.30 (-11.22%) |
400.00 |
315.00 - 420.00 |
0.2904 times |
Fri 31 January 2025 |
425.00 (-19.81%) |
530.00 |
408.50 - 556.40 |
0.3833 times |
Tue 31 December 2024 |
530.00 (33.99%) |
403.25 |
378.95 - 607.85 |
6.4243 times |

DMA SMA EMA moving averages of Softtech 543470
DMA (daily moving average) of Softtech 543470
| DMA period | DMA value | | 5 day DMA | 367.26 | | 12 day DMA | 371.64 | | 20 day DMA | 371.94 | | 35 day DMA | 377.22 | | 50 day DMA | 379.08 | | 100 day DMA | 373.84 | | 150 day DMA | 368.58 | | 200 day DMA | 392.04 | EMA (exponential moving average) of Softtech 543470
| EMA period | EMA current | EMA prev | EMA prev2 | | 5 day EMA | 370.55 | 369.97 | 365.01 | | 12 day EMA | 371.01 | 370.89 | 369.25 | | 20 day EMA | 372.45 | 372.53 | 371.75 | | 35 day EMA | 375.03 | 375.23 | 374.96 | | 50 day EMA | 377.71 | 377.96 | 377.88 |
SMA (simple moving average) of Softtech 543470
| SMA period | SMA current | SMA prev | SMA prev2 | | 5 day SMA | 367.26 | 367.81 | 365.54 | | 12 day SMA | 371.64 | 372.01 | 371.46 | | 20 day SMA | 371.94 | 372.01 | 371.55 | | 35 day SMA | 377.22 | 377.93 | 378.37 | | 50 day SMA | 379.08 | 379.24 | 379.32 | | 100 day SMA | 373.84 | 373.96 | 374.01 | | 150 day SMA | 368.58 | 368.77 | 369 | | 200 day SMA | 392.04 | 392.12 | 392.18 |
|
|
