Medplus 543427 full analysis,charts,indicators,moving averages,SMA,DMA,EMA,ADX,MACD,RSIMedplus 543427 WideScreen charts, DMA,SMA,EMA technical analysis, forecast prediction, by indicators ADX,MACD,RSI,CCI BSE stock exchange
Daily price and charts and targets Medplus Strong Daily Stock price targets for Medplus 543427 are 755.78 and 765.93 | Daily Target 1 | 753.35 | | Daily Target 2 | 758.2 | | Daily Target 3 | 763.5 | | Daily Target 4 | 768.35 | | Daily Target 5 | 773.65 |
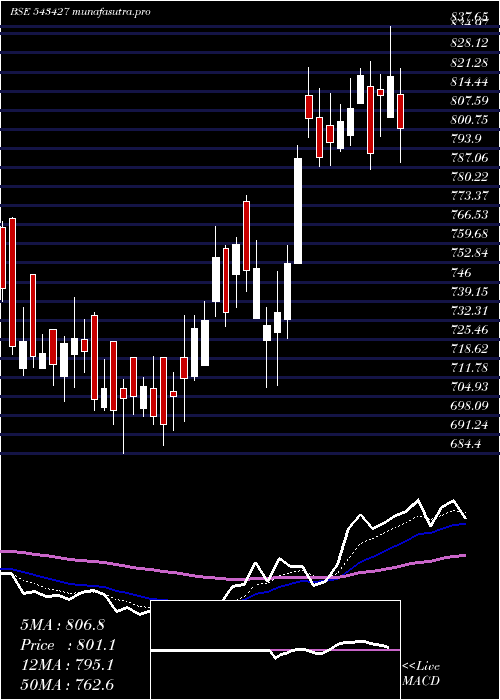
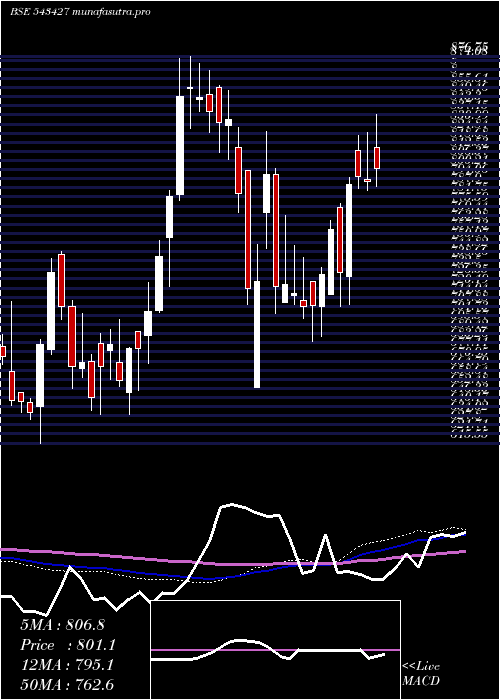
Daily price and volume Medplus
| Date |
Closing |
Open |
Range |
Volume |
Tue 21 October 2025 |
763.05 (-0.32%) |
765.80 |
758.65 - 768.80 |
0.165 times |
Mon 20 October 2025 |
765.50 (0.27%) |
780.00 |
758.10 - 780.00 |
0.268 times |
Fri 17 October 2025 |
763.45 (0.39%) |
759.75 |
755.20 - 770.00 |
1.1891 times |
Thu 16 October 2025 |
760.50 (0.62%) |
751.05 |
751.05 - 775.00 |
0.3915 times |
Wed 15 October 2025 |
755.85 (-1.86%) |
755.05 |
752.00 - 770.80 |
2.1475 times |
Tue 14 October 2025 |
770.20 (-0.93%) |
794.70 |
750.50 - 794.70 |
0.7161 times |
Mon 13 October 2025 |
777.40 (-0.84%) |
755.30 |
755.30 - 790.85 |
0.677 times |
Fri 10 October 2025 |
783.95 (0.92%) |
780.30 |
765.60 - 795.95 |
0.8664 times |
Thu 09 October 2025 |
776.80 (1.92%) |
766.20 |
760.00 - 783.90 |
0.9984 times |
Wed 08 October 2025 |
762.15 (1.72%) |
746.55 |
745.95 - 775.00 |
2.581 times |
Tue 07 October 2025 |
749.25 (-1.21%) |
757.95 |
746.40 - 762.10 |
0.8025 times |
Weekly price and charts Medplus Strong weekly Stock price targets for Medplus 543427 are 749.63 and 771.53 | Weekly Target 1 | 745.15 | | Weekly Target 2 | 754.1 | | Weekly Target 3 | 767.05 | | Weekly Target 4 | 776 | | Weekly Target 5 | 788.95 |
Weekly price and volumes for Medplus
| Date |
Closing |
Open |
Range |
Volume |
Tue 21 October 2025 |
763.05 (-0.05%) |
780.00 |
758.10 - 780.00 |
0.0719 times |
Fri 17 October 2025 |
763.45 (-2.61%) |
755.30 |
750.50 - 794.70 |
0.8505 times |
Fri 10 October 2025 |
783.95 (5.13%) |
741.55 |
734.55 - 795.95 |
1.3183 times |
Fri 03 October 2025 |
745.70 (-5.26%) |
771.50 |
731.95 - 797.05 |
1.1834 times |
Fri 26 September 2025 |
787.10 (-6.38%) |
821.20 |
777.50 - 841.20 |
1.6516 times |
Fri 19 September 2025 |
840.70 (0.18%) |
839.20 |
825.00 - 853.50 |
0.7626 times |
Fri 12 September 2025 |
839.20 (0.77%) |
831.20 |
823.55 - 844.00 |
0.766 times |
Fri 05 September 2025 |
832.75 (-1.08%) |
841.85 |
828.00 - 857.70 |
0.9996 times |
Fri 29 August 2025 |
841.85 (2.33%) |
821.05 |
821.05 - 850.05 |
1.2332 times |
Fri 22 August 2025 |
822.65 (1.14%) |
848.65 |
805.20 - 848.65 |
1.1629 times |
Thu 14 August 2025 |
813.35 (-1.05%) |
814.00 |
800.00 - 837.35 |
36.8344 times |
Monthly price and charts Medplus Strong monthly Stock price targets for Medplus 543427 are 747.5 and 811.5 | Monthly Target 1 | 699.65 | | Monthly Target 2 | 731.35 | | Monthly Target 3 | 763.65 | | Monthly Target 4 | 795.35 | | Monthly Target 5 | 827.65 |
Monthly price and volumes Medplus
| Date |
Closing |
Open |
Range |
Volume |
Tue 21 October 2025 |
763.05 (0.83%) |
757.45 |
731.95 - 795.95 |
0.1873 times |
Tue 30 September 2025 |
756.75 (-10.11%) |
841.85 |
748.90 - 857.70 |
0.3067 times |
Fri 29 August 2025 |
841.85 (-9.47%) |
934.95 |
800.00 - 936.90 |
5.0847 times |
Thu 31 July 2025 |
929.90 (3.44%) |
916.95 |
843.50 - 944.50 |
0.4272 times |
Mon 30 June 2025 |
899.00 (-7.16%) |
950.25 |
850.00 - 967.70 |
0.6118 times |
Fri 30 May 2025 |
968.35 (20.88%) |
802.65 |
787.45 - 1052.05 |
0.9901 times |
Wed 30 April 2025 |
801.10 (5.47%) |
774.75 |
708.05 - 837.65 |
0.3142 times |
Fri 28 March 2025 |
759.55 (6.01%) |
712.00 |
684.40 - 766.00 |
0.3121 times |
Fri 28 February 2025 |
716.50 (-1.12%) |
771.50 |
703.30 - 825.90 |
0.5905 times |
Fri 31 January 2025 |
724.60 (-12.88%) |
854.65 |
653.15 - 856.75 |
1.1754 times |
Tue 31 December 2024 |
831.75 (6.4%) |
783.05 |
779.05 - 876.75 |
2.1866 times |

DMA SMA EMA moving averages of Medplus 543427
DMA (daily moving average) of Medplus 543427
| DMA period | DMA value | | 5 day DMA | 761.67 | | 12 day DMA | 765.54 | | 20 day DMA | 768.96 | | 35 day DMA | 797.95 | | 50 day DMA | 806.97 | | 100 day DMA | 850.69 | | 150 day DMA | 832.42 | | 200 day DMA | 817.26 | EMA (exponential moving average) of Medplus 543427
| EMA period | EMA current | EMA prev | EMA prev2 | | 5 day EMA | 764.12 | 764.65 | 764.22 | | 12 day EMA | 767.72 | 768.57 | 769.13 | | 20 day EMA | 775.64 | 776.97 | 778.18 | | 35 day EMA | 789.82 | 791.4 | 792.92 | | 50 day EMA | 808.1 | 809.94 | 811.75 |
SMA (simple moving average) of Medplus 543427
| SMA period | SMA current | SMA prev | SMA prev2 | | 5 day SMA | 761.67 | 763.1 | 765.48 | | 12 day SMA | 765.54 | 764.1 | 762.15 | | 20 day SMA | 768.96 | 771.61 | 775.37 | | 35 day SMA | 797.95 | 799.95 | 802.13 | | 50 day SMA | 806.97 | 808.46 | 809.77 | | 100 day SMA | 850.69 | 852.73 | 854.58 | | 150 day SMA | 832.42 | 832.14 | 831.88 | | 200 day SMA | 817.26 | 817.69 | 818.11 |
|
|
