Tega 543413 full analysis,charts,indicators,moving averages,SMA,DMA,EMA,ADX,MACD,RSITega 543413 WideScreen charts, DMA,SMA,EMA technical analysis, forecast prediction, by indicators ADX,MACD,RSI,CCI BSE stock exchange
Daily price and charts and targets Tega Strong Daily Stock price targets for Tega 543413 are 1894.03 and 1929.03 | Daily Target 1 | 1866.03 | | Daily Target 2 | 1887.02 | | Daily Target 3 | 1901.0333333333 | | Daily Target 4 | 1922.02 | | Daily Target 5 | 1936.03 |
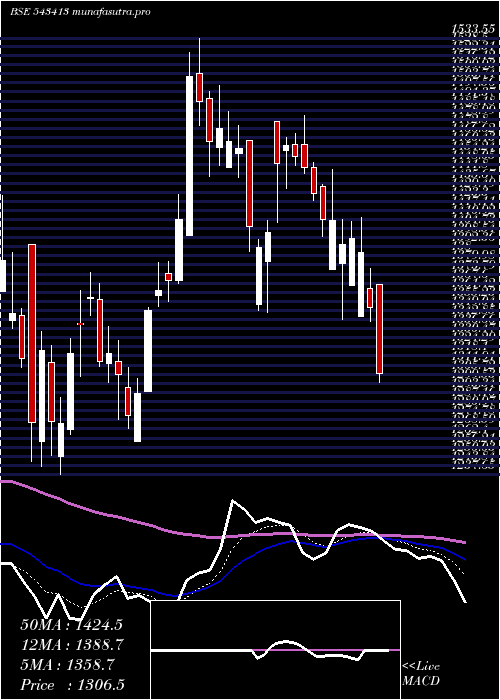
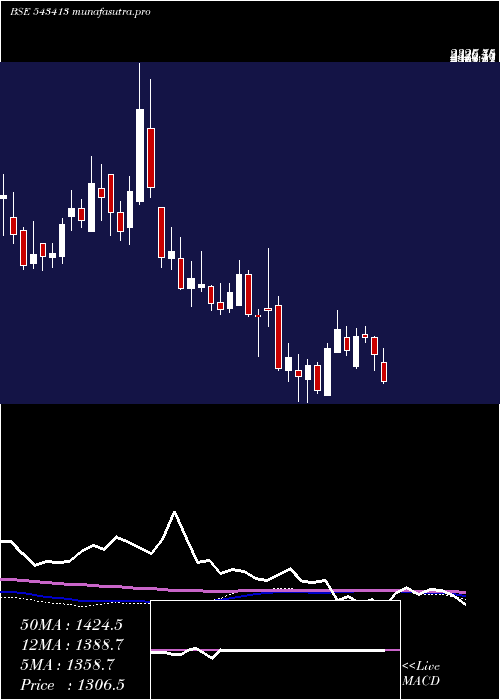
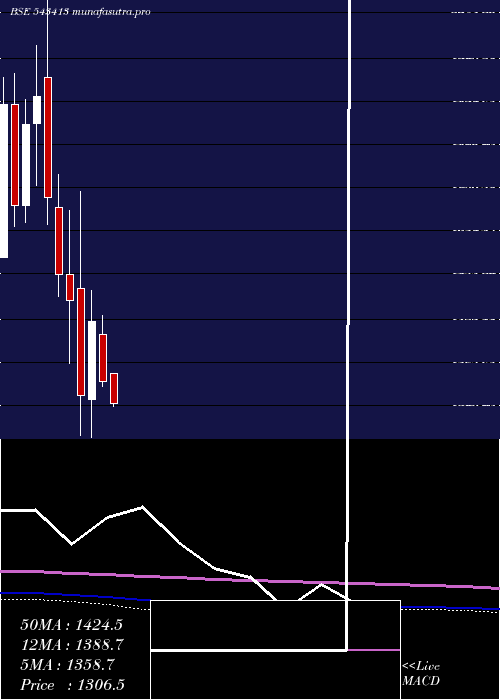
Daily price and volume Tega
| Date |
Closing |
Open |
Range |
Volume |
Fri 05 December 2025 |
1908.00 (0.52%) |
1880.05 |
1880.05 - 1915.05 |
0.2256 times |
Thu 04 December 2025 |
1898.10 (-1.75%) |
1933.70 |
1895.35 - 1945.45 |
0.2915 times |
Wed 03 December 2025 |
1931.85 (-0.3%) |
1938.10 |
1922.30 - 1950.00 |
0.1922 times |
Tue 02 December 2025 |
1937.60 (0.18%) |
1938.35 |
1919.80 - 1940.20 |
0.1164 times |
Mon 01 December 2025 |
1934.20 (-0.04%) |
1940.05 |
1927.90 - 1980.00 |
0.165 times |
Fri 28 November 2025 |
1934.90 (0.83%) |
1918.60 |
1917.80 - 1952.30 |
7.5064 times |
Thu 27 November 2025 |
1919.05 (-0.54%) |
1910.05 |
1910.05 - 1941.15 |
0.1574 times |
Wed 26 November 2025 |
1929.40 (2.22%) |
1887.50 |
1880.20 - 1935.00 |
0.3748 times |
Tue 25 November 2025 |
1887.45 (2.1%) |
1840.00 |
1818.00 - 1899.00 |
0.4253 times |
Mon 24 November 2025 |
1848.65 (-2.72%) |
1885.45 |
1840.00 - 1885.45 |
0.5455 times |
Fri 21 November 2025 |
1900.25 (-1.12%) |
1926.05 |
1874.30 - 1926.05 |
0.2461 times |
Weekly price and charts Tega Strong weekly Stock price targets for Tega 543413 are 1844.05 and 1944 | Weekly Target 1 | 1822.73 | | Weekly Target 2 | 1865.37 | | Weekly Target 3 | 1922.6833333333 | | Weekly Target 4 | 1965.32 | | Weekly Target 5 | 2022.63 |
Weekly price and volumes for Tega
| Date |
Closing |
Open |
Range |
Volume |
Fri 05 December 2025 |
1908.00 (-1.39%) |
1940.05 |
1880.05 - 1980.00 |
0.1799 times |
Fri 28 November 2025 |
1934.90 (1.82%) |
1885.45 |
1818.00 - 1952.30 |
1.6357 times |
Fri 21 November 2025 |
1900.25 (-1.79%) |
1957.00 |
1874.30 - 1965.15 |
0.1746 times |
Fri 14 November 2025 |
1934.90 (1.54%) |
1913.80 |
1904.00 - 1995.00 |
0.4669 times |
Fri 07 November 2025 |
1905.55 (-1.71%) |
1940.00 |
1873.55 - 1962.55 |
0.223 times |
Fri 31 October 2025 |
1938.65 (0.39%) |
1883.95 |
1880.00 - 1950.00 |
0.3673 times |
Thu 23 October 2025 |
1931.05 (2.39%) |
1888.15 |
1888.00 - 1943.90 |
0.1218 times |
Fri 17 October 2025 |
1886.00 (-3.02%) |
1917.85 |
1844.00 - 1951.20 |
0.2375 times |
Fri 10 October 2025 |
1944.65 (-1.7%) |
1969.95 |
1922.10 - 1989.00 |
0.5559 times |
Fri 03 October 2025 |
1978.20 (1.76%) |
1945.05 |
1870.20 - 1998.00 |
6.0374 times |
Fri 26 September 2025 |
1943.90 (-3.54%) |
2047.55 |
1903.30 - 2047.55 |
1.104 times |
Monthly price and charts Tega Strong monthly Stock price targets for Tega 543413 are 1844.05 and 1944 | Monthly Target 1 | 1822.73 | | Monthly Target 2 | 1865.37 | | Monthly Target 3 | 1922.6833333333 | | Monthly Target 4 | 1965.32 | | Monthly Target 5 | 2022.63 |
Monthly price and volumes Tega
| Date |
Closing |
Open |
Range |
Volume |
Fri 05 December 2025 |
1908.00 (-1.39%) |
1940.05 |
1880.05 - 1980.00 |
0.0452 times |
Fri 28 November 2025 |
1934.90 (-0.19%) |
1940.00 |
1818.00 - 1995.00 |
0.6279 times |
Fri 31 October 2025 |
1938.65 (2.48%) |
1890.95 |
1844.00 - 1998.00 |
0.4043 times |
Tue 30 September 2025 |
1891.75 (2.31%) |
1850.00 |
1849.10 - 2130.00 |
3.8137 times |
Fri 29 August 2025 |
1849.10 (-3.31%) |
1892.75 |
1763.05 - 1933.10 |
0.6392 times |
Thu 31 July 2025 |
1912.40 (23.15%) |
1555.00 |
1542.60 - 2012.10 |
3.3165 times |
Mon 30 June 2025 |
1552.95 (-5.87%) |
1651.80 |
1466.90 - 1677.95 |
0.2351 times |
Fri 30 May 2025 |
1649.80 (22.1%) |
1366.95 |
1205.75 - 1657.50 |
0.4533 times |
Wed 30 April 2025 |
1351.15 (-8.24%) |
1446.05 |
1341.60 - 1484.30 |
0.1391 times |
Fri 28 March 2025 |
1472.45 (11.36%) |
1314.00 |
1237.65 - 1533.55 |
0.3256 times |
Fri 28 February 2025 |
1322.20 (-12.63%) |
1539.00 |
1242.95 - 1733.65 |
0.4437 times |
DMA SMA EMA moving averages of Tega 543413
DMA (daily moving average) of Tega 543413
| DMA period | DMA value | | 5 day DMA | 1921.95 | | 12 day DMA | 1912.6 | | 20 day DMA | 1922.08 | | 35 day DMA | 1921.29 | | 50 day DMA | 1925.45 | | 100 day DMA | 1919.39 | | 150 day DMA | 1781.62 | | 200 day DMA | 1686.87 | EMA (exponential moving average) of Tega 543413
| EMA period | EMA current | EMA prev | EMA prev2 | | 5 day EMA | 1915.34 | 1919.01 | 1929.46 | | 12 day EMA | 1918.43 | 1920.32 | 1924.36 | | 20 day EMA | 1921.04 | 1922.41 | 1924.97 | | 35 day EMA | 1928.53 | 1929.74 | 1931.6 | | 50 day EMA | 1935.79 | 1936.92 | 1938.5 |
SMA (simple moving average) of Tega 543413
| SMA period | SMA current | SMA prev | SMA prev2 | | 5 day SMA | 1921.95 | 1927.33 | 1931.52 | | 12 day SMA | 1912.6 | 1913.76 | 1917.31 | | 20 day SMA | 1922.08 | 1922.02 | 1924.47 | | 35 day SMA | 1921.29 | 1921.92 | 1923.25 | | 50 day SMA | 1925.45 | 1927.59 | 1930.04 | | 100 day SMA | 1919.39 | 1917.77 | 1915.98 | | 150 day SMA | 1781.62 | 1778.22 | 1774.85 | | 200 day SMA | 1686.87 | 1684.97 | 1683.05 |
|
|
