Aaplustrad 543319 full analysis,charts,indicators,moving averages,SMA,DMA,EMA,ADX,MACD,RSIAaplustrad 543319 WideScreen charts, DMA,SMA,EMA technical analysis, forecast prediction, by indicators ADX,MACD,RSI,CCI BSE stock exchange
Daily price and charts and targets Aaplustrad Strong Daily Stock price targets for Aaplustrad 543319 are 1.06 and 1.06 | Daily Target 1 | 1.06 | | Daily Target 2 | 1.06 | | Daily Target 3 | 1.06 | | Daily Target 4 | 1.06 | | Daily Target 5 | 1.06 |
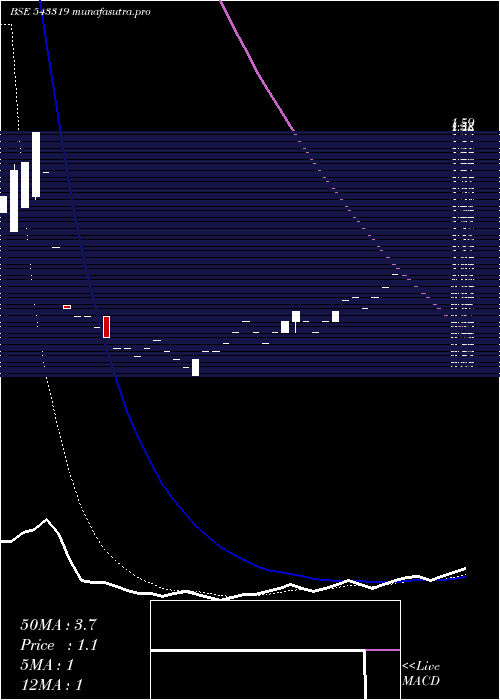
Daily price and volume Aaplustrad
| Date |
Closing |
Open |
Range |
Volume |
Thu 23 October 2025 |
1.06 (4.95%) |
1.06 |
1.06 - 1.06 |
0.5882 times |
Tue 21 October 2025 |
1.01 (4.12%) |
1.01 |
1.01 - 1.01 |
0.5882 times |
Mon 20 October 2025 |
0.97 (4.3%) |
0.97 |
0.97 - 0.97 |
2.9412 times |
Wed 08 October 2025 |
0.93 (-4.12%) |
0.93 |
0.93 - 0.93 |
0.5882 times |
Tue 07 October 2025 |
0.97 (1.04%) |
0.97 |
0.97 - 0.97 |
0.5882 times |
Mon 06 October 2025 |
0.96 (4.35%) |
0.96 |
0.96 - 0.96 |
0.5882 times |
Fri 03 October 2025 |
0.92 (4.55%) |
0.88 |
0.88 - 0.92 |
1.7647 times |
Mon 29 September 2025 |
0.88 (4.76%) |
0.88 |
0.88 - 0.88 |
0.5882 times |
Fri 19 September 2025 |
0.84 (-4.55%) |
0.84 |
0.84 - 0.84 |
1.1765 times |
Thu 18 September 2025 |
0.88 (-4.35%) |
0.88 |
0.88 - 0.88 |
0.5882 times |
Wed 17 September 2025 |
0.92 (4.55%) |
0.88 |
0.84 - 0.92 |
3.5294 times |
Weekly price and charts Aaplustrad Strong weekly Stock price targets for Aaplustrad 543319 are 1.02 and 1.11 | Weekly Target 1 | 0.94 | | Weekly Target 2 | 1 | | Weekly Target 3 | 1.03 | | Weekly Target 4 | 1.09 | | Weekly Target 5 | 1.12 |
Weekly price and volumes for Aaplustrad
| Date |
Closing |
Open |
Range |
Volume |
Thu 23 October 2025 |
1.06 (13.98%) |
0.97 |
0.97 - 1.06 |
1.4894 times |
Wed 08 October 2025 |
0.93 (1.09%) |
0.96 |
0.93 - 0.97 |
0.6383 times |
Fri 03 October 2025 |
0.92 (9.52%) |
0.88 |
0.88 - 0.92 |
0.8511 times |
Fri 19 September 2025 |
0.84 (5%) |
0.84 |
0.84 - 0.92 |
2.5532 times |
Mon 08 September 2025 |
0.80 (-4.76%) |
0.80 |
0.80 - 0.80 |
0.2128 times |
Tue 02 September 2025 |
0.84 (-4.55%) |
0.84 |
0.84 - 0.84 |
0.2128 times |
Thu 24 July 2025 |
0.88 (14.29%) |
0.77 |
0.77 - 0.88 |
1.9149 times |
Fri 18 July 2025 |
0.77 (8.45%) |
0.68 |
0.68 - 0.77 |
0.6383 times |
Fri 04 July 2025 |
0.71 (-12.35%) |
0.77 |
0.71 - 0.77 |
0.6383 times |
Thu 12 June 2025 |
0.81 (8%) |
0.78 |
0.78 - 0.81 |
0.8511 times |
Wed 28 May 2025 |
0.75 (-3.85%) |
0.78 |
0.75 - 0.78 |
0.4255 times |

Monthly price and charts Aaplustrad Strong monthly Stock price targets for Aaplustrad 543319 are 0.97 and 1.15 | Monthly Target 1 | 0.82 | | Monthly Target 2 | 0.94 | | Monthly Target 3 | 1 | | Monthly Target 4 | 1.12 | | Monthly Target 5 | 1.18 |
Monthly price and volumes Aaplustrad
| Date |
Closing |
Open |
Range |
Volume |
Thu 23 October 2025 |
1.06 (20.45%) |
0.88 |
0.88 - 1.06 |
1.0085 times |
Mon 29 September 2025 |
0.88 (0%) |
0.84 |
0.80 - 0.92 |
1.1637 times |
Thu 24 July 2025 |
0.88 (18.92%) |
0.71 |
0.68 - 0.88 |
1.0085 times |
Thu 26 June 2025 |
0.74 (-1.33%) |
0.78 |
0.74 - 0.81 |
0.4655 times |
Wed 28 May 2025 |
0.75 (-16.67%) |
0.90 |
0.75 - 0.90 |
0.8534 times |
Fri 25 April 2025 |
0.90 (-37.5%) |
1.16 |
0.90 - 1.16 |
0.7758 times |
Mon 24 March 2025 |
1.44 (-9.43%) |
1.44 |
1.44 - 1.44 |
0.0776 times |
Thu 13 February 2025 |
1.59 (17.78%) |
1.29 |
1.22 - 1.59 |
1.3189 times |
Mon 20 January 2025 |
1.35 (-90.61%) |
14.15 |
1.35 - 15.03 |
0.9232 times |
Tue 31 December 2024 |
14.38 (18.35%) |
11.85 |
11.85 - 15.15 |
2.405 times |
Fri 29 November 2024 |
12.15 (-22.56%) |
14.91 |
11.94 - 15.65 |
0.7991 times |

DMA SMA EMA moving averages of Aaplustrad 543319
DMA (daily moving average) of Aaplustrad 543319
| DMA period | DMA value | | 5 day DMA | 0.99 | | 12 day DMA | 0.94 | | 20 day DMA | 0.89 | | 35 day DMA | 0.86 | | 50 day DMA | 3.3 | | 100 day DMA | 10.36 | | 150 day DMA | 12.48 | | 200 day DMA | 11.45 | EMA (exponential moving average) of Aaplustrad 543319
| EMA period | EMA current | EMA prev | EMA prev2 | | 5 day EMA | 0.99 | 0.96 | 0.94 | | 12 day EMA | 0.96 | 0.94 | 0.93 | | 20 day EMA | 1.19 | 1.2 | 1.22 | | 35 day EMA | 2.56 | 2.65 | 2.75 | | 50 day EMA | 3.87 | 3.98 | 4.1 |
SMA (simple moving average) of Aaplustrad 543319
| SMA period | SMA current | SMA prev | SMA prev2 | | 5 day SMA | 0.99 | 0.97 | 0.95 | | 12 day SMA | 0.94 | 0.92 | 0.9 | | 20 day SMA | 0.89 | 0.87 | 0.86 | | 35 day SMA | 0.86 | 0.87 | 0.89 | | 50 day SMA | 3.3 | 3.54 | 3.77 | | 100 day SMA | 10.36 | 10.54 | 10.73 | | 150 day SMA | 12.48 | 12.54 | 12.6 | | 200 day SMA | 11.45 | 11.48 | 11.52 |
|
|
