Biret 543261 full analysis,charts,indicators,moving averages,SMA,DMA,EMA,ADX,MACD,RSIBiret 543261 WideScreen charts, DMA,SMA,EMA technical analysis, forecast prediction, by indicators ADX,MACD,RSI,CCI BSE stock exchange
Daily price and charts and targets Biret Strong Daily Stock price targets for Biret 543261 are 329.32 and 348.06 | Daily Target 1 | 325.38 | | Daily Target 2 | 333.25 | | Daily Target 3 | 344.12333333333 | | Daily Target 4 | 351.99 | | Daily Target 5 | 362.86 |
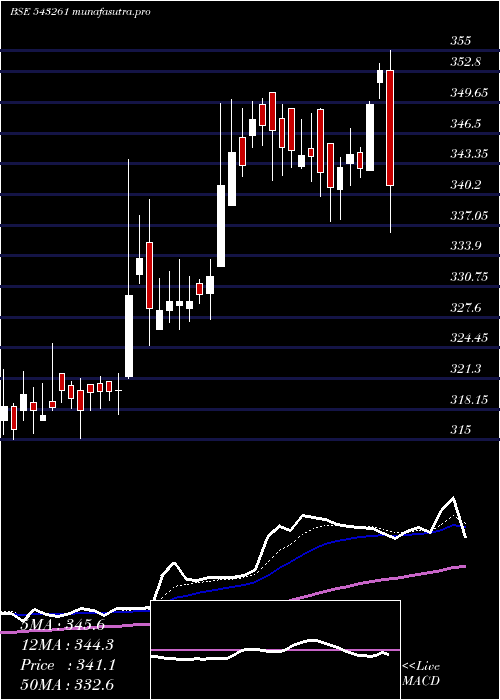
Daily price and volume Biret
| Date |
Closing |
Open |
Range |
Volume |
Thu 23 October 2025 |
341.11 (-3.35%) |
352.93 |
336.26 - 355.00 |
2.0852 times |
Tue 21 October 2025 |
352.93 (0.99%) |
351.70 |
350.01 - 353.65 |
0.5813 times |
Mon 20 October 2025 |
349.48 (1.93%) |
342.70 |
342.70 - 349.75 |
1.549 times |
Fri 17 October 2025 |
342.86 (-0.41%) |
344.50 |
342.00 - 345.00 |
0.4689 times |
Thu 16 October 2025 |
344.26 (0.39%) |
343.40 |
341.16 - 347.00 |
1.7218 times |
Wed 15 October 2025 |
342.93 (0.59%) |
340.75 |
337.65 - 344.00 |
0.5421 times |
Tue 14 October 2025 |
340.93 (-0.44%) |
345.40 |
337.43 - 345.40 |
0.8065 times |
Mon 13 October 2025 |
342.43 (-0.47%) |
348.99 |
340.00 - 349.00 |
0.9817 times |
Fri 10 October 2025 |
344.05 (-0.03%) |
344.96 |
341.51 - 348.50 |
0.4315 times |
Thu 09 October 2025 |
344.17 (-0.15%) |
343.10 |
342.87 - 347.89 |
0.8319 times |
Wed 08 October 2025 |
344.70 (-0.09%) |
349.00 |
343.00 - 349.00 |
0.9492 times |
Weekly price and charts Biret Strong weekly Stock price targets for Biret 543261 are 329.32 and 348.06 | Weekly Target 1 | 325.38 | | Weekly Target 2 | 333.25 | | Weekly Target 3 | 344.12333333333 | | Weekly Target 4 | 351.99 | | Weekly Target 5 | 362.86 |
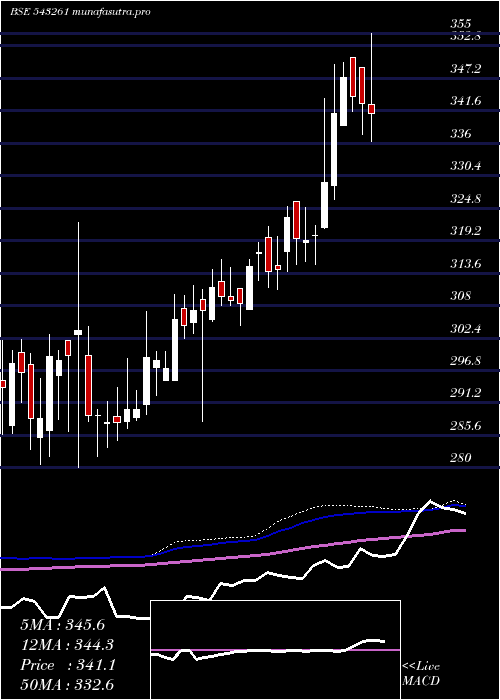
Weekly price and volumes for Biret
| Date |
Closing |
Open |
Range |
Volume |
Thu 23 October 2025 |
341.11 (-0.51%) |
342.70 |
336.26 - 355.00 |
0.7916 times |
Fri 17 October 2025 |
342.86 (-0.35%) |
348.99 |
337.43 - 349.00 |
0.8489 times |
Fri 10 October 2025 |
344.05 (-0.93%) |
350.70 |
341.51 - 350.70 |
0.7345 times |
Fri 03 October 2025 |
347.28 (1.8%) |
339.10 |
339.10 - 350.00 |
1.0192 times |
Fri 26 September 2025 |
341.13 (3.62%) |
328.80 |
326.36 - 349.56 |
1.6954 times |
Fri 19 September 2025 |
329.22 (2.84%) |
321.50 |
321.25 - 343.78 |
1.3601 times |
Fri 12 September 2025 |
320.12 (0.29%) |
320.10 |
315.11 - 321.78 |
0.5516 times |
Fri 05 September 2025 |
319.21 (-0.12%) |
318.80 |
315.61 - 324.88 |
0.6057 times |
Fri 29 August 2025 |
319.60 (-1.09%) |
326.00 |
315.00 - 326.00 |
1.7404 times |
Fri 22 August 2025 |
323.12 (2.85%) |
317.40 |
313.90 - 325.00 |
0.6526 times |
Thu 14 August 2025 |
314.16 (0.09%) |
314.97 |
310.85 - 320.00 |
1.0526 times |
Monthly price and charts Biret Strong monthly Stock price targets for Biret 543261 are 329.32 and 348.06 | Monthly Target 1 | 325.38 | | Monthly Target 2 | 333.25 | | Monthly Target 3 | 344.12333333333 | | Monthly Target 4 | 351.99 | | Monthly Target 5 | 362.86 |
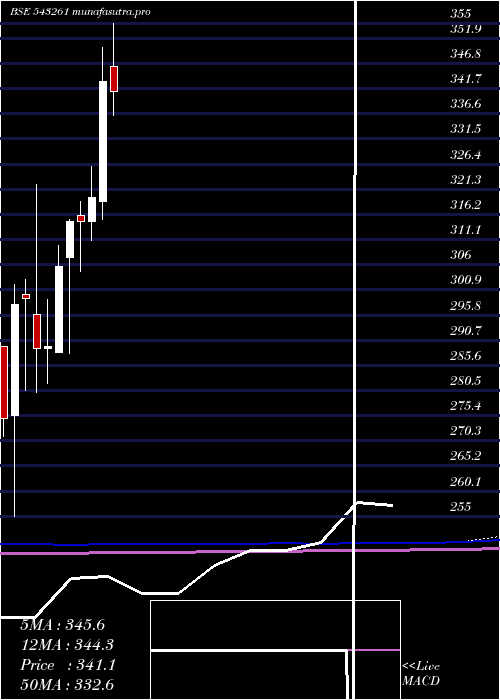
Monthly price and volumes Biret
| Date |
Closing |
Open |
Range |
Volume |
Thu 23 October 2025 |
341.11 (-0.62%) |
346.23 |
336.26 - 355.00 |
0.0356 times |
Tue 30 September 2025 |
343.23 (7.39%) |
318.80 |
315.11 - 349.99 |
0.0594 times |
Fri 29 August 2025 |
319.60 (1.53%) |
314.77 |
310.85 - 326.00 |
0.064 times |
Thu 31 July 2025 |
314.77 (0.02%) |
316.00 |
304.55 - 318.84 |
0.0496 times |
Mon 30 June 2025 |
314.70 (2.97%) |
307.40 |
288.00 - 315.22 |
0.0481 times |
Fri 30 May 2025 |
305.61 (5.6%) |
288.20 |
288.20 - 309.86 |
0.0916 times |
Wed 30 April 2025 |
289.39 (0.11%) |
289.08 |
282.00 - 298.88 |
0.2435 times |
Fri 28 March 2025 |
289.08 (-3.35%) |
296.01 |
280.00 - 322.28 |
9.285 times |
Fri 28 February 2025 |
299.11 (0.37%) |
299.95 |
280.56 - 303.00 |
0.0425 times |
Fri 31 January 2025 |
298.01 (8.47%) |
275.50 |
255.00 - 302.00 |
0.0807 times |
Tue 31 December 2024 |
274.73 (-4.91%) |
291.99 |
270.00 - 293.00 |
0.0632 times |
DMA SMA EMA moving averages of Biret 543261
DMA (daily moving average) of Biret 543261
| DMA period | DMA value | | 5 day DMA | 346.13 | | 12 day DMA | 344.57 | | 20 day DMA | 343.37 | | 35 day DMA | 335.17 | | 50 day DMA | 329.94 | | 100 day DMA | 320.25 | | 150 day DMA | 311.43 | | 200 day DMA | 305.94 | EMA (exponential moving average) of Biret 543261
| EMA period | EMA current | EMA prev | EMA prev2 | | 5 day EMA | 345.58 | 347.82 | 345.27 | | 12 day EMA | 344.3 | 344.88 | 343.42 | | 20 day EMA | 341.76 | 341.83 | 340.66 | | 35 day EMA | 336.55 | 336.28 | 335.3 | | 50 day EMA | 330.5 | 330.07 | 329.14 |
SMA (simple moving average) of Biret 543261
| SMA period | SMA current | SMA prev | SMA prev2 | | 5 day SMA | 346.13 | 346.49 | 344.09 | | 12 day SMA | 344.57 | 345.05 | 344.58 | | 20 day SMA | 343.37 | 342.78 | 341.59 | | 35 day SMA | 335.17 | 334.49 | 333.5 | | 50 day SMA | 329.94 | 329.39 | 328.73 | | 100 day SMA | 320.25 | 319.9 | 319.4 | | 150 day SMA | 311.43 | 311.13 | 310.74 | | 200 day SMA | 305.94 | 305.66 | 305.26 |
|
|
