Infrabees 543255 full analysis,charts,indicators,moving averages,SMA,DMA,EMA,ADX,MACD,RSIInfrabees 543255 WideScreen charts, DMA,SMA,EMA technical analysis, forecast prediction, by indicators ADX,MACD,RSI,CCI BSE stock exchange
Daily price and charts and targets Infrabees Strong Daily Stock price targets for Infrabees 543255 are 980.27 and 989.12 | Daily Target 1 | 973.07 | | Daily Target 2 | 978.62 | | Daily Target 3 | 981.92333333333 | | Daily Target 4 | 987.47 | | Daily Target 5 | 990.77 |
Daily price and volume Infrabees
| Date |
Closing |
Open |
Range |
Volume |
Fri 05 December 2025 |
984.16 (0.12%) |
976.38 |
976.38 - 985.23 |
1.108 times |
Thu 04 December 2025 |
982.95 (-0.3%) |
981.04 |
977.74 - 986.54 |
1.1342 times |
Wed 03 December 2025 |
985.90 (-0.33%) |
989.06 |
979.75 - 989.23 |
1.9246 times |
Tue 02 December 2025 |
989.15 (-0.55%) |
995.99 |
986.41 - 997.46 |
1.1168 times |
Mon 01 December 2025 |
994.65 (-0.06%) |
997.77 |
994.00 - 1001.43 |
1.7041 times |
Fri 28 November 2025 |
995.25 (-0.29%) |
997.34 |
994.36 - 1000.65 |
0.4061 times |
Thu 27 November 2025 |
998.13 (-0.19%) |
1002.57 |
996.83 - 1003.28 |
0.4496 times |
Wed 26 November 2025 |
1000.00 (0.9%) |
992.00 |
991.10 - 1000.00 |
0.3901 times |
Tue 25 November 2025 |
991.04 (0.17%) |
989.01 |
989.01 - 994.17 |
0.9964 times |
Mon 24 November 2025 |
989.37 (-0.73%) |
993.97 |
988.07 - 997.70 |
0.7701 times |
Fri 21 November 2025 |
996.62 (-0.4%) |
1000.64 |
995.06 - 1002.03 |
2.7629 times |
Weekly price and charts Infrabees Strong weekly Stock price targets for Infrabees 543255 are 967.75 and 992.8 | Weekly Target 1 | 962.27 | | Weekly Target 2 | 973.22 | | Weekly Target 3 | 987.32333333333 | | Weekly Target 4 | 998.27 | | Weekly Target 5 | 1012.37 |
Weekly price and volumes for Infrabees
| Date |
Closing |
Open |
Range |
Volume |
Fri 05 December 2025 |
984.16 (-1.11%) |
997.77 |
976.38 - 1001.43 |
0.9855 times |
Fri 28 November 2025 |
995.25 (-0.14%) |
993.97 |
988.07 - 1003.28 |
0.4248 times |
Fri 21 November 2025 |
996.62 (0.44%) |
996.56 |
990.78 - 1002.80 |
0.7942 times |
Fri 14 November 2025 |
992.23 (2.14%) |
973.67 |
969.18 - 995.97 |
0.883 times |
Fri 07 November 2025 |
971.48 (-1.37%) |
986.03 |
968.00 - 995.00 |
0.6776 times |
Fri 31 October 2025 |
984.96 (1.38%) |
975.00 |
975.00 - 1001.20 |
1.3273 times |
Thu 23 October 2025 |
971.55 (0.87%) |
969.07 |
968.78 - 981.43 |
0.4201 times |
Fri 17 October 2025 |
963.18 (1.63%) |
943.25 |
939.92 - 967.55 |
0.8065 times |
Fri 10 October 2025 |
947.77 (1.03%) |
936.41 |
934.27 - 949.70 |
2.8628 times |
Fri 03 October 2025 |
938.13 (0.46%) |
938.47 |
921.78 - 940.40 |
0.8182 times |
Fri 26 September 2025 |
933.81 (-2.12%) |
957.52 |
931.70 - 964.00 |
2.6484 times |
Monthly price and charts Infrabees Strong monthly Stock price targets for Infrabees 543255 are 967.75 and 992.8 | Monthly Target 1 | 962.27 | | Monthly Target 2 | 973.22 | | Monthly Target 3 | 987.32333333333 | | Monthly Target 4 | 998.27 | | Monthly Target 5 | 1012.37 |
Monthly price and volumes Infrabees
| Date |
Closing |
Open |
Range |
Volume |
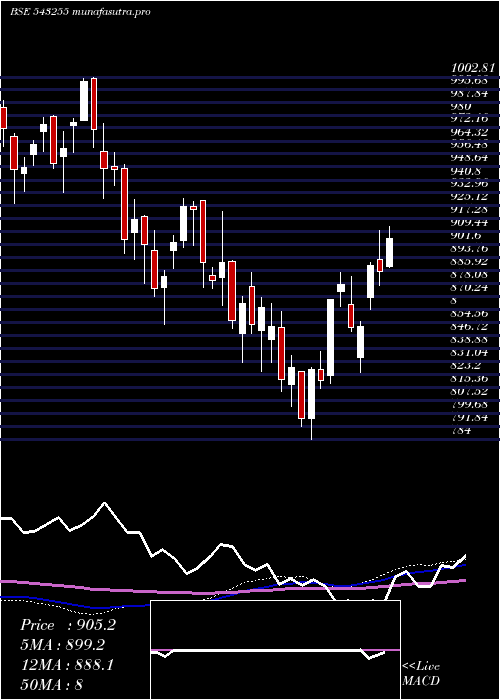
Fri 05 December 2025 |
984.16 (-1.11%) |
997.77 |
976.38 - 1001.43 |
0.1685 times |
Fri 28 November 2025 |
995.25 (1.04%) |
986.03 |
968.00 - 1003.28 |
0.4753 times |
Fri 31 October 2025 |
984.96 (5.69%) |
940.40 |
921.78 - 1001.20 |
1.0073 times |
Tue 30 September 2025 |
931.95 (1.71%) |
919.90 |
914.97 - 964.00 |
1.3133 times |
Fri 29 August 2025 |
916.30 (-2%) |
933.70 |
914.78 - 953.46 |
0.8067 times |
Thu 31 July 2025 |
935.03 (-3.48%) |
961.20 |
928.00 - 978.54 |
0.9474 times |
Mon 30 June 2025 |
968.76 (4.93%) |
922.26 |
917.33 - 994.00 |
1.4044 times |
Fri 30 May 2025 |
923.23 (2%) |
905.31 |
886.18 - 942.00 |
1.3106 times |
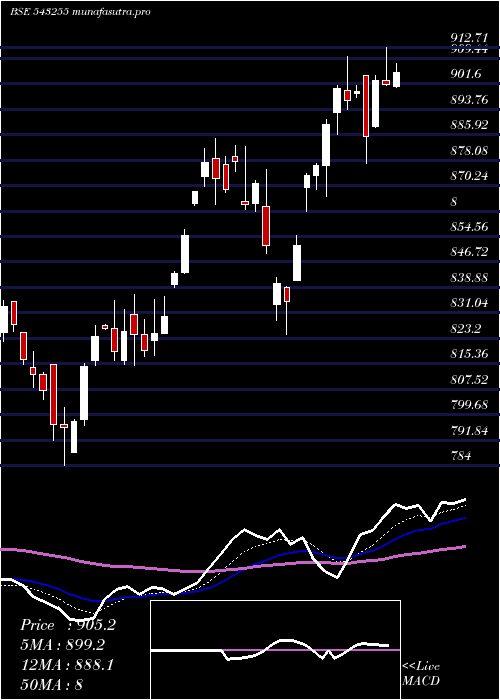
Wed 30 April 2025 |
905.16 (3.13%) |
865.41 |
824.31 - 912.71 |
1.0564 times |
Fri 28 March 2025 |
877.66 (10.18%) |
796.55 |
784.00 - 884.71 |
1.5101 times |
Fri 28 February 2025 |
796.60 (-7.8%) |
844.15 |
791.92 - 866.34 |
1.2559 times |

DMA SMA EMA moving averages of Infrabees 543255
DMA (daily moving average) of Infrabees 543255
| DMA period | DMA value | | 5 day DMA | 987.36 | | 12 day DMA | 992.32 | | 20 day DMA | 989.69 | | 35 day DMA | 983.75 | | 50 day DMA | 970.93 | | 100 day DMA | 954.85 | | 150 day DMA | 947.92 | | 200 day DMA | 922.1 | EMA (exponential moving average) of Infrabees 543255
| EMA period | EMA current | EMA prev | EMA prev2 | | 5 day EMA | 986.87 | 988.22 | 990.85 | | 12 day EMA | 989.27 | 990.2 | 991.52 | | 20 day EMA | 987.71 | 988.08 | 988.62 | | 35 day EMA | 979.62 | 979.35 | 979.14 | | 50 day EMA | 970.67 | 970.12 | 969.6 |
SMA (simple moving average) of Infrabees 543255
| SMA period | SMA current | SMA prev | SMA prev2 | | 5 day SMA | 987.36 | 989.58 | 992.62 | | 12 day SMA | 992.32 | 993.18 | 994.23 | | 20 day SMA | 989.69 | 989.39 | 989.49 | | 35 day SMA | 983.75 | 982.68 | 981.68 | | 50 day SMA | 970.93 | 970.33 | 969.74 | | 100 day SMA | 954.85 | 954.71 | 954.65 | | 150 day SMA | 947.92 | 947.38 | 946.73 | | 200 day SMA | 922.1 | 921.37 | 920.78 |
|
|
