Maxhealth 543220 full analysis,charts,indicators,moving averages,SMA,DMA,EMA,ADX,MACD,RSIMaxhealth 543220 WideScreen charts, DMA,SMA,EMA technical analysis, forecast prediction, by indicators ADX,MACD,RSI,CCI BSE stock exchange
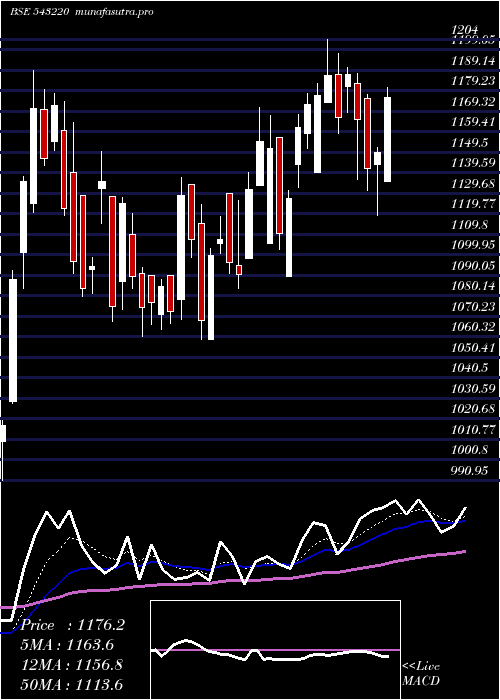
Daily price and charts and targets Maxhealth Strong Daily Stock price targets for Maxhealth 543220 are 1193.08 and 1210.78 | Daily Target 1 | 1189.82 | | Daily Target 2 | 1196.33 | | Daily Target 3 | 1207.5166666667 | | Daily Target 4 | 1214.03 | | Daily Target 5 | 1225.22 |
Daily price and volume Maxhealth
| Date |
Closing |
Open |
Range |
Volume |
Tue 21 October 2025 |
1202.85 (-0.53%) |
1206.25 |
1201.00 - 1218.70 |
0.2541 times |
Mon 20 October 2025 |
1209.30 (0.58%) |
1213.75 |
1203.60 - 1217.10 |
0.3886 times |
Fri 17 October 2025 |
1202.35 (2.31%) |
1175.60 |
1175.60 - 1212.40 |
4.1518 times |
Thu 16 October 2025 |
1175.20 (1.68%) |
1160.60 |
1159.50 - 1177.15 |
0.7846 times |
Wed 15 October 2025 |
1155.80 (-0.42%) |
1166.75 |
1154.40 - 1172.65 |
1.2402 times |
Tue 14 October 2025 |
1160.65 (1.47%) |
1150.00 |
1141.70 - 1164.95 |
0.7482 times |
Mon 13 October 2025 |
1143.85 (-1.09%) |
1157.00 |
1140.10 - 1169.00 |
1.0224 times |
Fri 10 October 2025 |
1156.45 (0.06%) |
1169.05 |
1138.85 - 1169.05 |
0.5168 times |
Thu 09 October 2025 |
1155.70 (1.04%) |
1144.25 |
1132.20 - 1162.70 |
0.412 times |
Wed 08 October 2025 |
1143.85 (1.17%) |
1123.55 |
1123.55 - 1147.00 |
0.4813 times |
Tue 07 October 2025 |
1130.60 (-0.72%) |
1134.70 |
1115.15 - 1139.95 |
1.801 times |
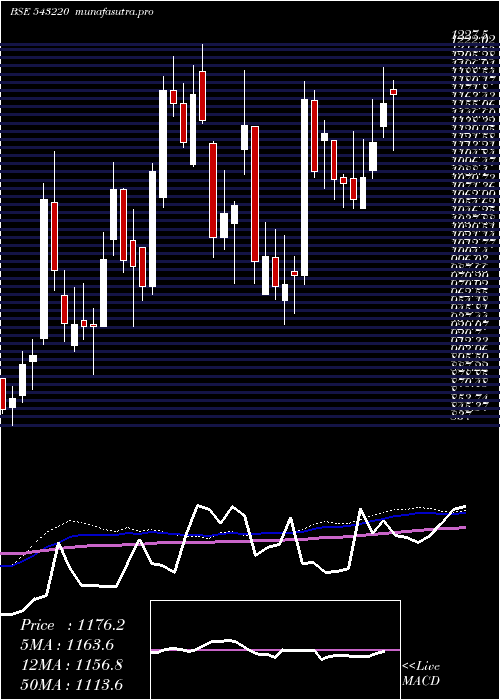
Weekly price and charts Maxhealth Strong weekly Stock price targets for Maxhealth 543220 are 1193.08 and 1210.78 | Weekly Target 1 | 1189.82 | | Weekly Target 2 | 1196.33 | | Weekly Target 3 | 1207.5166666667 | | Weekly Target 4 | 1214.03 | | Weekly Target 5 | 1225.22 |
Weekly price and volumes for Maxhealth
| Date |
Closing |
Open |
Range |
Volume |
Tue 21 October 2025 |
1202.85 (0.04%) |
1213.75 |
1201.00 - 1218.70 |
0.0886 times |
Fri 17 October 2025 |
1202.35 (3.97%) |
1157.00 |
1140.10 - 1212.40 |
1.0957 times |
Fri 10 October 2025 |
1156.45 (8.18%) |
1093.10 |
1093.10 - 1169.05 |
1.395 times |
Fri 03 October 2025 |
1069.05 (-4.83%) |
1123.65 |
1060.00 - 1138.50 |
1.5494 times |
Fri 26 September 2025 |
1123.25 (-3.24%) |
1158.55 |
1106.75 - 1179.95 |
1.5813 times |
Fri 19 September 2025 |
1160.85 (-1.93%) |
1194.70 |
1141.75 - 1194.70 |
0.5484 times |
Fri 12 September 2025 |
1183.75 (1.16%) |
1179.90 |
1140.00 - 1187.15 |
1.4997 times |
Fri 05 September 2025 |
1170.20 (1.38%) |
1156.05 |
1150.75 - 1199.00 |
0.4112 times |
Fri 29 August 2025 |
1154.30 (-6.54%) |
1237.05 |
1147.05 - 1252.00 |
0.4219 times |
Fri 22 August 2025 |
1235.10 (1.2%) |
1220.45 |
1206.65 - 1258.95 |
1.4086 times |
Thu 14 August 2025 |
1220.45 (-1.93%) |
1249.00 |
1204.05 - 1301.95 |
0.7815 times |
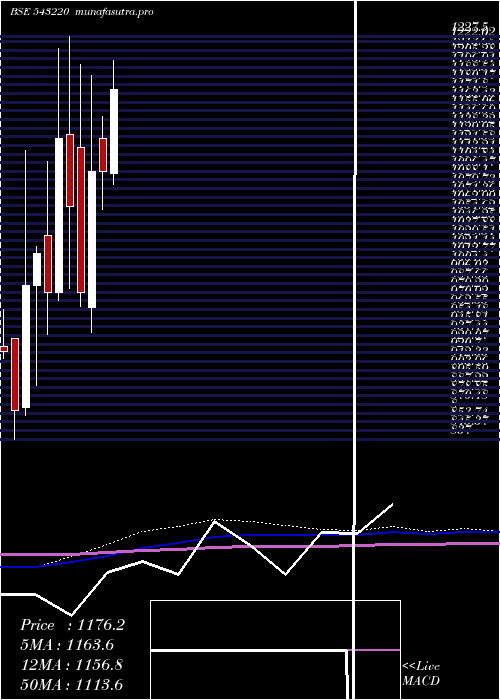
Monthly price and charts Maxhealth Strong monthly Stock price targets for Maxhealth 543220 are 1131.43 and 1290.13 | Monthly Target 1 | 1001.82 | | Monthly Target 2 | 1102.33 | | Monthly Target 3 | 1160.5166666667 | | Monthly Target 4 | 1261.03 | | Monthly Target 5 | 1319.22 |
Monthly price and volumes Maxhealth
| Date |
Closing |
Open |
Range |
Volume |
Tue 21 October 2025 |
1202.85 (7.8%) |
1118.05 |
1060.00 - 1218.70 |
0.7317 times |
Tue 30 September 2025 |
1115.85 (-3.33%) |
1156.05 |
1102.40 - 1199.00 |
1.2306 times |
Fri 29 August 2025 |
1154.30 (-7.2%) |
1236.05 |
1147.05 - 1301.95 |
0.729 times |
Thu 31 July 2025 |
1243.80 (-2.46%) |
1294.60 |
1200.70 - 1314.30 |
0.9464 times |
Mon 30 June 2025 |
1275.20 (13.36%) |
1132.70 |
1122.65 - 1296.65 |
1.6463 times |
Fri 30 May 2025 |
1124.95 (2.62%) |
1094.80 |
1083.50 - 1204.00 |
1.0399 times |
Wed 30 April 2025 |
1096.20 (-0.05%) |
1128.70 |
1059.05 - 1149.75 |
0.4187 times |
Fri 28 March 2025 |
1096.70 (12.04%) |
964.95 |
940.35 - 1189.25 |
0.5095 times |
Fri 28 February 2025 |
978.85 (-7.85%) |
1120.00 |
965.70 - 1200.35 |
0.8363 times |
Fri 31 January 2025 |
1062.25 (-5.88%) |
1131.85 |
982.50 - 1227.50 |
1.9116 times |
Tue 31 December 2024 |
1128.60 (15.25%) |
979.00 |
971.20 - 1215.00 |
0.814 times |
DMA SMA EMA moving averages of Maxhealth 543220
DMA (daily moving average) of Maxhealth 543220
| DMA period | DMA value | | 5 day DMA | 1189.1 | | 12 day DMA | 1164.62 | | 20 day DMA | 1146.94 | | 35 day DMA | 1155.19 | | 50 day DMA | 1174.79 | | 100 day DMA | 1203.04 | | 150 day DMA | 1170.74 | | 200 day DMA | 1147.5 | EMA (exponential moving average) of Maxhealth 543220
| EMA period | EMA current | EMA prev | EMA prev2 | | 5 day EMA | 1191.34 | 1185.59 | 1173.74 | | 12 day EMA | 1171.2 | 1165.45 | 1157.48 | | 20 day EMA | 1164.38 | 1160.33 | 1155.18 | | 35 day EMA | 1170.5 | 1168.6 | 1166.2 | | 50 day EMA | 1183.51 | 1182.72 | 1181.64 |
SMA (simple moving average) of Maxhealth 543220
| SMA period | SMA current | SMA prev | SMA prev2 | | 5 day SMA | 1189.1 | 1180.66 | 1167.57 | | 12 day SMA | 1164.62 | 1153.47 | 1145.4 | | 20 day SMA | 1146.94 | 1145.32 | 1142.89 | | 35 day SMA | 1155.19 | 1154.53 | 1152.96 | | 50 day SMA | 1174.79 | 1176.08 | 1177.33 | | 100 day SMA | 1203.04 | 1202.52 | 1202.01 | | 150 day SMA | 1170.74 | 1169.54 | 1168.07 | | 200 day SMA | 1147.5 | 1147.19 | 1146.97 |
|
|
