Powerindia 543187 full analysis,charts,indicators,moving averages,SMA,DMA,EMA,ADX,MACD,RSIPowerindia 543187 WideScreen charts, DMA,SMA,EMA technical analysis, forecast prediction, by indicators ADX,MACD,RSI,CCI BSE stock exchange
Daily price and charts and targets Powerindia Strong Daily Stock price targets for Powerindia 543187 are 17325.4 and 17553.1 | Daily Target 1 | 17278.45 | | Daily Target 2 | 17372.35 | | Daily Target 3 | 17506.15 | | Daily Target 4 | 17600.05 | | Daily Target 5 | 17733.85 |
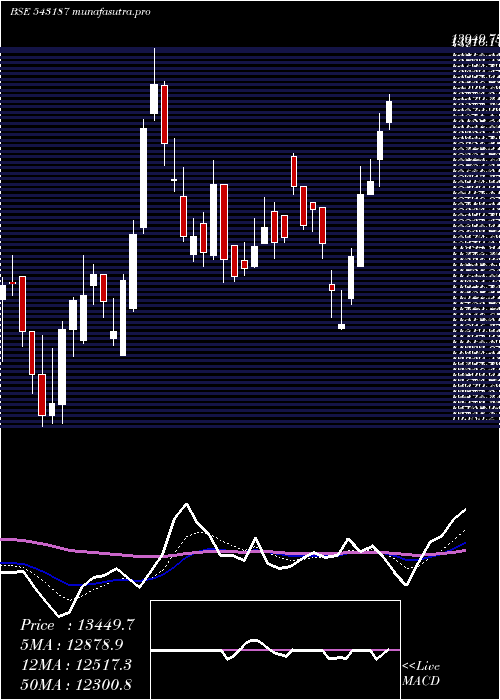
Daily price and volume Powerindia
| Date |
Closing |
Open |
Range |
Volume |
Tue 21 October 2025 |
17466.25 (0.08%) |
17639.95 |
17412.25 - 17639.95 |
0.2331 times |
Mon 20 October 2025 |
17452.65 (0.13%) |
17435.10 |
17380.00 - 17679.65 |
1.9831 times |
Fri 17 October 2025 |
17429.55 (-1.45%) |
17686.00 |
17390.00 - 17769.55 |
0.7087 times |
Thu 16 October 2025 |
17686.20 (1.18%) |
17480.00 |
17325.30 - 17789.00 |
0.7895 times |
Wed 15 October 2025 |
17480.35 (-0.1%) |
17311.05 |
17084.05 - 17519.75 |
1.6029 times |
Tue 14 October 2025 |
17497.70 (-1.59%) |
17994.95 |
17259.00 - 17994.95 |
0.6576 times |
Mon 13 October 2025 |
17779.55 (0.82%) |
17600.00 |
17375.00 - 17820.00 |
0.8227 times |
Fri 10 October 2025 |
17634.65 (-0.35%) |
17849.15 |
17600.00 - 17985.00 |
0.825 times |
Thu 09 October 2025 |
17697.15 (-0.4%) |
17998.95 |
17560.00 - 18020.00 |
0.7773 times |
Wed 08 October 2025 |
17768.70 (1.27%) |
17780.00 |
17560.00 - 18196.40 |
1.6 times |
Tue 07 October 2025 |
17545.10 (-3.61%) |
18379.45 |
17424.90 - 18509.40 |
1.9163 times |
Weekly price and charts Powerindia Strong weekly Stock price targets for Powerindia 543187 are 17423.13 and 17722.78 | Weekly Target 1 | 17208.98 | | Weekly Target 2 | 17337.62 | | Weekly Target 3 | 17508.633333333 | | Weekly Target 4 | 17637.27 | | Weekly Target 5 | 17808.28 |
Weekly price and volumes for Powerindia
| Date |
Closing |
Open |
Range |
Volume |
Tue 21 October 2025 |
17466.25 (0.21%) |
17435.10 |
17380.00 - 17679.65 |
0.173 times |
Fri 17 October 2025 |
17429.55 (-1.16%) |
17600.00 |
17084.05 - 17994.95 |
0.3575 times |
Fri 10 October 2025 |
17634.65 (-3.16%) |
18138.55 |
17424.90 - 18509.40 |
0.4659 times |
Fri 03 October 2025 |
18209.40 (-5.02%) |
19200.15 |
17640.55 - 19710.00 |
1.0591 times |
Fri 26 September 2025 |
19172.10 (0.77%) |
19050.05 |
18850.05 - 19781.90 |
1.1141 times |
Fri 19 September 2025 |
19025.70 (-4.41%) |
20144.45 |
18878.30 - 20440.00 |
0.9808 times |
Fri 12 September 2025 |
19904.35 (5.62%) |
19304.90 |
18641.60 - 20275.00 |
0.9559 times |
Fri 05 September 2025 |
18845.95 (-1.4%) |
19299.85 |
18700.00 - 19434.10 |
1.0264 times |
Fri 29 August 2025 |
19114.20 (-3.86%) |
19881.85 |
18901.35 - 20144.70 |
2.103 times |
Fri 22 August 2025 |
19880.80 (-2.48%) |
20600.30 |
19456.00 - 20744.95 |
1.7644 times |
Thu 14 August 2025 |
20387.35 (0.51%) |
20300.55 |
20028.80 - 21784.80 |
1.6739 times |

Monthly price and charts Powerindia Strong monthly Stock price targets for Powerindia 543187 are 16542.18 and 18008.13 | Monthly Target 1 | 16234.15 | | Monthly Target 2 | 16850.2 | | Monthly Target 3 | 17700.1 | | Monthly Target 4 | 18316.15 | | Monthly Target 5 | 19166.05 |
Monthly price and volumes Powerindia
| Date |
Closing |
Open |
Range |
Volume |
Tue 21 October 2025 |
17466.25 (-2.84%) |
18050.00 |
17084.05 - 18550.00 |
0.2325 times |
Tue 30 September 2025 |
17976.25 (-5.95%) |
19299.85 |
17865.00 - 20440.00 |
0.8844 times |
Fri 29 August 2025 |
19114.20 (-4.88%) |
20100.15 |
18901.35 - 21784.80 |
1.4128 times |
Thu 31 July 2025 |
20095.05 (0.56%) |
20489.75 |
18336.60 - 21350.00 |
1.2784 times |
Mon 30 June 2025 |
19983.00 (3.2%) |
19499.85 |
16702.40 - 20700.00 |
1.2223 times |
Fri 30 May 2025 |
19364.00 (33.59%) |
14594.95 |
14151.05 - 19716.90 |
1.0312 times |
Wed 30 April 2025 |
14495.10 (14.6%) |
12649.80 |
11299.65 - 14879.00 |
0.7062 times |
Fri 28 March 2025 |
12648.70 (12.12%) |
11059.35 |
11059.35 - 13949.75 |
1.02 times |
Fri 28 February 2025 |
11281.70 (-12.1%) |
11556.10 |
10385.20 - 12820.00 |
1.1904 times |
Fri 31 January 2025 |
12834.90 (-10.89%) |
14773.95 |
8738.05 - 15623.15 |
1.0218 times |
Tue 31 December 2024 |
14402.95 (20.33%) |
12199.95 |
11552.25 - 15073.30 |
0.3842 times |

DMA SMA EMA moving averages of Powerindia 543187
DMA (daily moving average) of Powerindia 543187
| DMA period | DMA value | | 5 day DMA | 17503 | | 12 day DMA | 17636.7 | | 20 day DMA | 18080.78 | | 35 day DMA | 18624.73 | | 50 day DMA | 19031.38 | | 100 day DMA | 19165.06 | | 150 day DMA | 17417.45 | | 200 day DMA | 16200.69 | EMA (exponential moving average) of Powerindia 543187
| EMA period | EMA current | EMA prev | EMA prev2 | | 5 day EMA | 17510.85 | 17533.15 | 17573.39 | | 12 day EMA | 17733.7 | 17782.31 | 17842.23 | | 20 day EMA | 18038.39 | 18098.59 | 18166.55 | | 35 day EMA | 18518.49 | 18580.44 | 18646.84 | | 50 day EMA | 19027.1 | 19090.78 | 19157.61 |
SMA (simple moving average) of Powerindia 543187
| SMA period | SMA current | SMA prev | SMA prev2 | | 5 day SMA | 17503 | 17509.29 | 17574.67 | | 12 day SMA | 17636.7 | 17698.63 | 17758.22 | | 20 day SMA | 18080.78 | 18163.23 | 18241.89 | | 35 day SMA | 18624.73 | 18667.07 | 18714.54 | | 50 day SMA | 19031.38 | 19096.37 | 19155.43 | | 100 day SMA | 19165.06 | 19174.03 | 19172.79 | | 150 day SMA | 17417.45 | 17388.96 | 17353.91 | | 200 day SMA | 16200.69 | 16181.29 | 16160.56 |
|
|
