Swsolar 542760 full analysis,charts,indicators,moving averages,SMA,DMA,EMA,ADX,MACD,RSISwsolar 542760 WideScreen charts, DMA,SMA,EMA technical analysis, forecast prediction, by indicators ADX,MACD,RSI,CCI BSE stock exchange
Daily price and charts and targets Swsolar Strong Daily Stock price targets for Swsolar 542760 are 213.23 and 237.13 | Daily Target 1 | 208.7 | | Daily Target 2 | 217.75 | | Daily Target 3 | 232.6 | | Daily Target 4 | 241.65 | | Daily Target 5 | 256.5 |
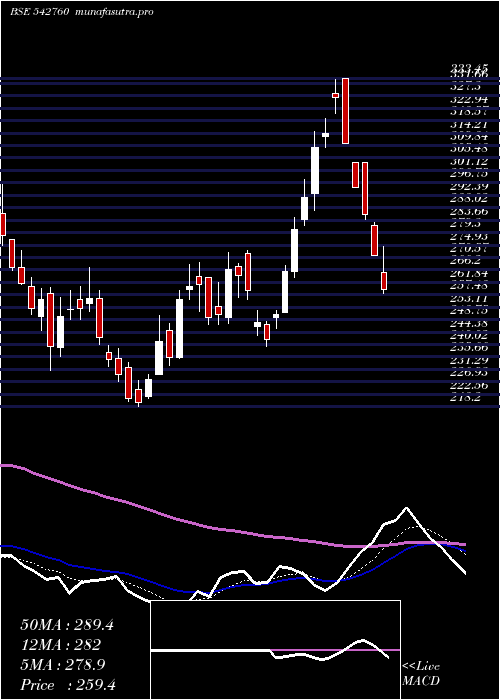
Daily price and volume Swsolar
| Date |
Closing |
Open |
Range |
Volume |
Fri 17 October 2025 |
226.80 (-6.71%) |
244.20 |
223.55 - 247.45 |
4.6468 times |
Thu 16 October 2025 |
243.10 (-0.18%) |
243.10 |
241.95 - 246.75 |
0.3912 times |
Wed 15 October 2025 |
243.55 (-0.18%) |
244.00 |
242.40 - 245.25 |
0.3705 times |
Tue 14 October 2025 |
244.00 (-2.5%) |
250.05 |
242.60 - 250.75 |
0.6246 times |
Mon 13 October 2025 |
250.25 (0.32%) |
248.95 |
246.20 - 253.00 |
0.7072 times |
Fri 10 October 2025 |
249.45 (4.18%) |
239.10 |
239.10 - 250.50 |
1.0684 times |
Thu 09 October 2025 |
239.45 (-0.97%) |
242.00 |
238.10 - 242.00 |
0.6459 times |
Wed 08 October 2025 |
241.80 (1.47%) |
239.90 |
237.50 - 242.80 |
0.792 times |
Tue 07 October 2025 |
238.30 (-1.53%) |
242.35 |
237.60 - 243.25 |
0.2871 times |
Mon 06 October 2025 |
242.00 (-1.67%) |
246.20 |
241.60 - 247.95 |
0.4663 times |
Fri 03 October 2025 |
246.10 (0.47%) |
246.45 |
245.05 - 248.75 |
0.6496 times |
Weekly price and charts Swsolar Strong weekly Stock price targets for Swsolar 542760 are 210.45 and 239.9 | Weekly Target 1 | 205 | | Weekly Target 2 | 215.9 | | Weekly Target 3 | 234.45 | | Weekly Target 4 | 245.35 | | Weekly Target 5 | 263.9 |
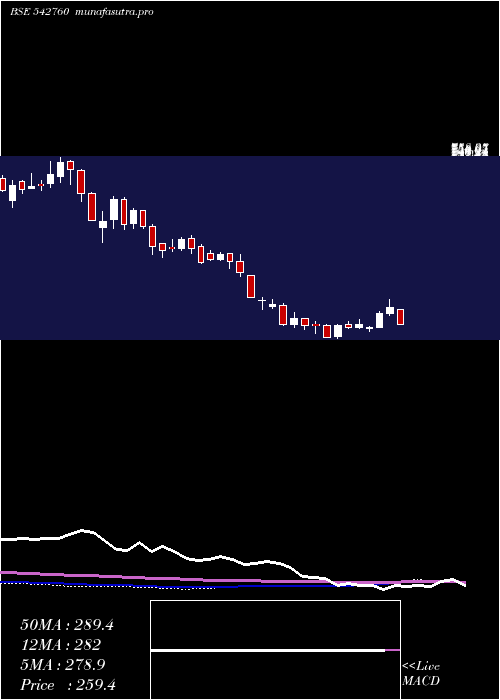
Weekly price and volumes for Swsolar
| Date |
Closing |
Open |
Range |
Volume |
Fri 17 October 2025 |
226.80 (-9.08%) |
248.95 |
223.55 - 253.00 |
1.6816 times |
Fri 10 October 2025 |
249.45 (1.36%) |
246.20 |
237.50 - 250.50 |
0.8132 times |
Fri 03 October 2025 |
246.10 (1.38%) |
242.95 |
235.00 - 250.20 |
0.7721 times |
Fri 26 September 2025 |
242.75 (-10.37%) |
271.80 |
241.40 - 272.80 |
0.9786 times |
Fri 19 September 2025 |
270.85 (2.59%) |
265.55 |
264.80 - 272.75 |
0.8583 times |
Fri 12 September 2025 |
264.00 (0.36%) |
265.85 |
262.60 - 281.90 |
1.5194 times |
Fri 05 September 2025 |
263.05 (1.15%) |
260.95 |
259.75 - 275.20 |
0.9376 times |
Fri 29 August 2025 |
260.05 (-6.69%) |
278.65 |
259.00 - 280.60 |
0.7017 times |
Fri 22 August 2025 |
278.70 (4.07%) |
271.90 |
268.20 - 286.45 |
1.1578 times |
Thu 14 August 2025 |
267.80 (-2.3%) |
274.75 |
265.00 - 283.90 |
0.5794 times |
Fri 08 August 2025 |
274.10 (1.73%) |
268.40 |
256.05 - 280.95 |
0.9722 times |
Monthly price and charts Swsolar Strong monthly Stock price targets for Swsolar 542760 are 210.45 and 239.9 | Monthly Target 1 | 205 | | Monthly Target 2 | 215.9 | | Monthly Target 3 | 234.45 | | Monthly Target 4 | 245.35 | | Monthly Target 5 | 263.9 |
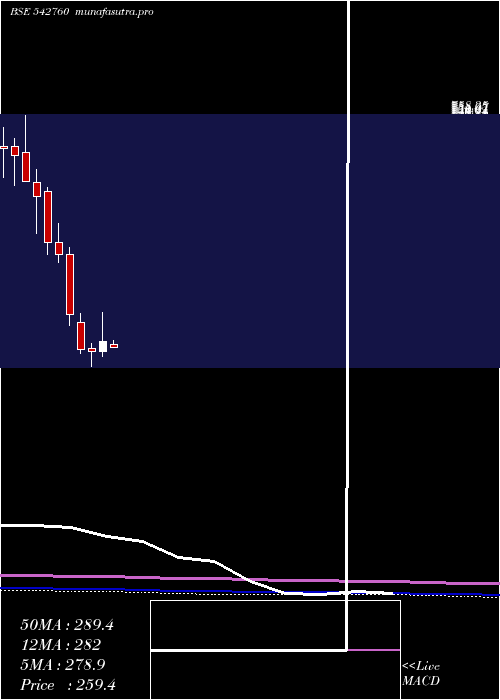
Monthly price and volumes Swsolar
| Date |
Closing |
Open |
Range |
Volume |
Fri 17 October 2025 |
226.80 (-6.44%) |
241.55 |
223.55 - 253.00 |
0.5103 times |
Tue 30 September 2025 |
242.40 (-6.79%) |
260.95 |
235.00 - 281.90 |
0.8668 times |
Fri 29 August 2025 |
260.05 (-7.64%) |
280.15 |
256.05 - 286.45 |
0.6854 times |
Thu 31 July 2025 |
281.55 (-11.96%) |
320.10 |
279.35 - 341.00 |
1.4689 times |
Mon 30 June 2025 |
319.80 (13.28%) |
285.75 |
284.80 - 348.90 |
1.2841 times |
Fri 30 May 2025 |
282.30 (4.04%) |
265.30 |
244.85 - 304.55 |
0.6957 times |
Wed 30 April 2025 |
271.35 (8.32%) |
249.45 |
239.30 - 333.45 |
0.9988 times |
Fri 28 March 2025 |
250.50 (-2.03%) |
257.80 |
218.20 - 268.65 |
1.2601 times |
Fri 28 February 2025 |
255.70 (-22.78%) |
313.40 |
245.00 - 332.80 |
1.0133 times |
Fri 31 January 2025 |
331.15 (-27.78%) |
458.55 |
305.45 - 475.35 |
1.2165 times |
Tue 31 December 2024 |
458.55 (-5.72%) |
486.30 |
441.45 - 526.00 |
0.4125 times |
DMA SMA EMA moving averages of Swsolar 542760
DMA (daily moving average) of Swsolar 542760
| DMA period | DMA value | | 5 day DMA | 241.54 | | 12 day DMA | 242.48 | | 20 day DMA | 247.15 | | 35 day DMA | 255.44 | | 50 day DMA | 260.36 | | 100 day DMA | 283.86 | | 150 day DMA | 277.9 | | 200 day DMA | 298.79 | EMA (exponential moving average) of Swsolar 542760
| EMA period | EMA current | EMA prev | EMA prev2 | | 5 day EMA | 238.42 | 244.23 | 244.8 | | 12 day EMA | 242.93 | 245.86 | 246.36 | | 20 day EMA | 246.96 | 249.08 | 249.71 | | 35 day EMA | 253.05 | 254.6 | 255.28 | | 50 day EMA | 259.8 | 261.15 | 261.89 |
SMA (simple moving average) of Swsolar 542760
| SMA period | SMA current | SMA prev | SMA prev2 | | 5 day SMA | 241.54 | 246.07 | 245.34 | | 12 day SMA | 242.48 | 243.78 | 243.64 | | 20 day SMA | 247.15 | 249.14 | 250.4 | | 35 day SMA | 255.44 | 256.45 | 257.12 | | 50 day SMA | 260.36 | 261.28 | 261.92 | | 100 day SMA | 283.86 | 284.47 | 284.79 | | 150 day SMA | 277.9 | 277.98 | 278.06 | | 200 day SMA | 298.79 | 300 | 301.09 |
|
|
