Spandana 542759 full analysis,charts,indicators,moving averages,SMA,DMA,EMA,ADX,MACD,RSISpandana 542759 WideScreen charts, DMA,SMA,EMA technical analysis, forecast prediction, by indicators ADX,MACD,RSI,CCI BSE stock exchange
Daily price and charts and targets Spandana Strong Daily Stock price targets for Spandana 542759 are 247.2 and 251.85 | Daily Target 1 | 243.68 | | Daily Target 2 | 246.07 | | Daily Target 3 | 248.33333333333 | | Daily Target 4 | 250.72 | | Daily Target 5 | 252.98 |
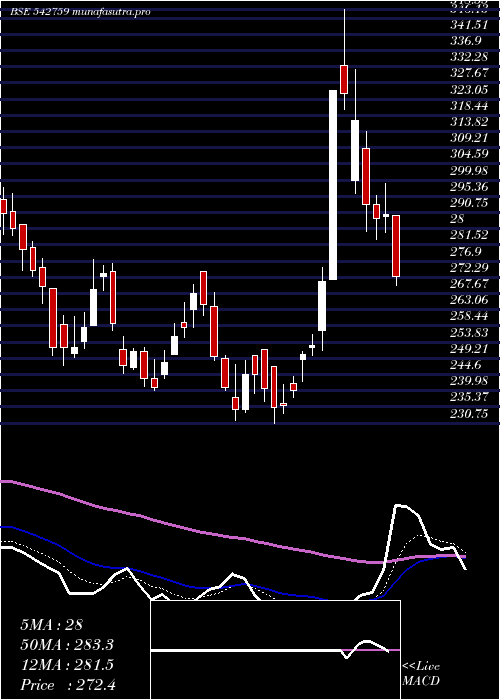
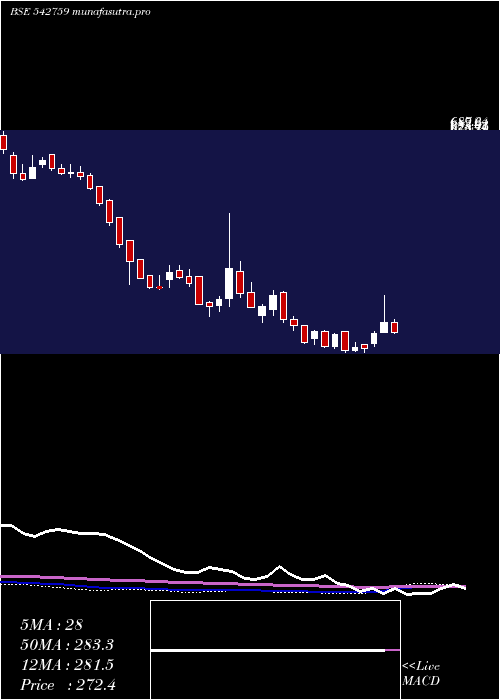
Daily price and volume Spandana
| Date |
Closing |
Open |
Range |
Volume |
Tue 21 October 2025 |
248.45 (0.65%) |
247.00 |
245.95 - 250.60 |
0.6932 times |
Mon 20 October 2025 |
246.85 (2.11%) |
240.15 |
240.15 - 249.00 |
0.9779 times |
Fri 17 October 2025 |
241.75 (-1.57%) |
245.65 |
240.80 - 246.00 |
1.5927 times |
Thu 16 October 2025 |
245.60 (-0.53%) |
246.95 |
245.20 - 250.45 |
1.294 times |
Wed 15 October 2025 |
246.90 (-0.68%) |
255.00 |
245.45 - 255.00 |
0.4971 times |
Tue 14 October 2025 |
248.60 (-1.66%) |
251.00 |
247.20 - 255.10 |
0.5757 times |
Mon 13 October 2025 |
252.80 (-0.88%) |
252.55 |
251.15 - 254.55 |
0.9557 times |
Fri 10 October 2025 |
255.05 (1.07%) |
253.50 |
252.15 - 259.25 |
1.1133 times |
Thu 09 October 2025 |
252.35 (-1.31%) |
254.75 |
251.30 - 258.15 |
1.014 times |
Wed 08 October 2025 |
255.70 (-1.43%) |
254.00 |
254.00 - 260.45 |
1.2863 times |
Tue 07 October 2025 |
259.40 (-0.5%) |
258.75 |
256.60 - 264.45 |
0.882 times |
Weekly price and charts Spandana Strong weekly Stock price targets for Spandana 542759 are 244.3 and 254.75 | Weekly Target 1 | 235.95 | | Weekly Target 2 | 242.2 | | Weekly Target 3 | 246.4 | | Weekly Target 4 | 252.65 | | Weekly Target 5 | 256.85 |
Weekly price and volumes for Spandana
| Date |
Closing |
Open |
Range |
Volume |
Tue 21 October 2025 |
248.45 (2.77%) |
240.15 |
240.15 - 250.60 |
0.1485 times |
Fri 17 October 2025 |
241.75 (-5.21%) |
252.55 |
240.80 - 255.10 |
0.4367 times |
Fri 10 October 2025 |
255.05 (-2.58%) |
262.25 |
251.30 - 266.40 |
0.4629 times |
Fri 03 October 2025 |
261.80 (4.59%) |
245.40 |
245.00 - 263.95 |
0.7846 times |
Fri 26 September 2025 |
250.30 (-5.53%) |
264.75 |
249.90 - 268.00 |
1.7531 times |
Fri 19 September 2025 |
264.95 (1.77%) |
257.40 |
257.40 - 278.80 |
1.511 times |
Fri 12 September 2025 |
260.35 (-0.97%) |
262.15 |
255.00 - 271.75 |
0.8287 times |
Fri 05 September 2025 |
262.90 (8.03%) |
244.65 |
244.35 - 280.00 |
2.4981 times |
Fri 29 August 2025 |
243.35 (-2.09%) |
249.60 |
240.80 - 254.00 |
0.478 times |
Fri 22 August 2025 |
248.55 (3.43%) |
240.20 |
238.10 - 251.60 |
1.0985 times |
Thu 14 August 2025 |
240.30 (-1.88%) |
248.95 |
239.00 - 252.50 |
0.9792 times |
Monthly price and charts Spandana Strong monthly Stock price targets for Spandana 542759 are 244.3 and 270.55 | Monthly Target 1 | 225.42 | | Monthly Target 2 | 236.93 | | Monthly Target 3 | 251.66666666667 | | Monthly Target 4 | 263.18 | | Monthly Target 5 | 277.92 |
Monthly price and volumes Spandana
| Date |
Closing |
Open |
Range |
Volume |
Tue 21 October 2025 |
248.45 (-0.82%) |
245.60 |
240.15 - 266.40 |
0.126 times |
Tue 30 September 2025 |
250.50 (2.94%) |
244.65 |
244.35 - 280.00 |
0.5387 times |
Fri 29 August 2025 |
243.35 (-9.94%) |
270.10 |
233.90 - 271.05 |
0.3473 times |
Thu 31 July 2025 |
270.20 (-3.12%) |
276.05 |
264.05 - 321.85 |
0.7517 times |
Mon 30 June 2025 |
278.90 (-3.91%) |
262.35 |
256.75 - 293.50 |
0.7548 times |
Fri 30 May 2025 |
290.25 (6.55%) |
278.00 |
248.00 - 305.95 |
0.6079 times |
Wed 30 April 2025 |
272.40 (16.06%) |
234.75 |
230.75 - 348.55 |
0.7297 times |
Fri 28 March 2025 |
234.70 (-6.98%) |
258.80 |
231.50 - 277.35 |
0.8282 times |
Fri 28 February 2025 |
252.30 (-22.79%) |
318.95 |
250.00 - 360.10 |
0.9102 times |
Fri 31 January 2025 |
326.75 (-1.34%) |
331.20 |
293.05 - 519.00 |
4.4055 times |
Tue 31 December 2024 |
331.20 (-16.49%) |
399.95 |
305.50 - 411.30 |
0.6877 times |

DMA SMA EMA moving averages of Spandana 542759
DMA (daily moving average) of Spandana 542759
| DMA period | DMA value | | 5 day DMA | 245.91 | | 12 day DMA | 251.18 | | 20 day DMA | 252.53 | | 35 day DMA | 256.69 | | 50 day DMA | 253.31 | | 100 day DMA | 265.93 | | 150 day DMA | 267.54 | | 200 day DMA | 282.34 | EMA (exponential moving average) of Spandana 542759
| EMA period | EMA current | EMA prev | EMA prev2 | | 5 day EMA | 247.26 | 246.67 | 246.58 | | 12 day EMA | 249.8 | 250.05 | 250.63 | | 20 day EMA | 251.74 | 252.09 | 252.64 | | 35 day EMA | 252.1 | 252.32 | 252.64 | | 50 day EMA | 252.49 | 252.65 | 252.89 |
SMA (simple moving average) of Spandana 542759
| SMA period | SMA current | SMA prev | SMA prev2 | | 5 day SMA | 245.91 | 245.94 | 247.13 | | 12 day SMA | 251.18 | 252.29 | 252.88 | | 20 day SMA | 252.53 | 253.33 | 254.23 | | 35 day SMA | 256.69 | 256.66 | 256.56 | | 50 day SMA | 253.31 | 253.4 | 253.31 | | 100 day SMA | 265.93 | 266.38 | 266.81 | | 150 day SMA | 267.54 | 267.6 | 267.63 | | 200 day SMA | 282.34 | 282.7 | 283.12 |
|
|
