Metropolis 542650 full analysis,charts,indicators,moving averages,SMA,DMA,EMA,ADX,MACD,RSIMetropolis 542650 WideScreen charts, DMA,SMA,EMA technical analysis, forecast prediction, by indicators ADX,MACD,RSI,CCI BSE stock exchange
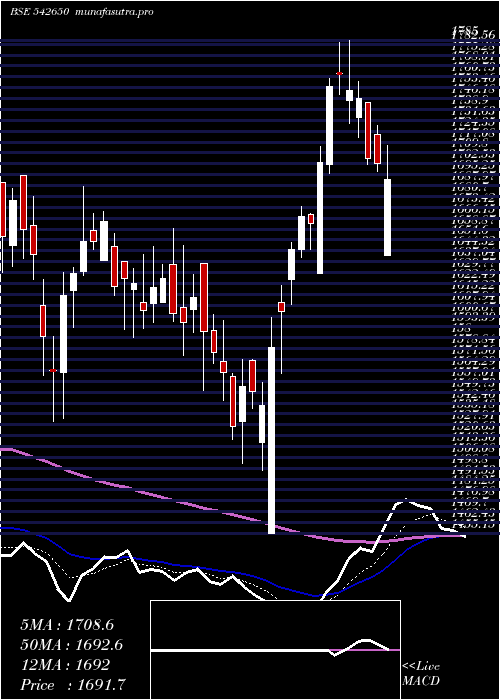
Daily price and charts and targets Metropolis Strong Daily Stock price targets for Metropolis 542650 are 2180.4 and 2285.65 | Daily Target 1 | 2101.45 | | Daily Target 2 | 2154.1 | | Daily Target 3 | 2206.7 | | Daily Target 4 | 2259.35 | | Daily Target 5 | 2311.95 |
Daily price and volume Metropolis
| Date |
Closing |
Open |
Range |
Volume |
Wed 03 September 2025 |
2206.75 (1.53%) |
2174.15 |
2154.05 - 2259.30 |
1.4226 times |
Tue 02 September 2025 |
2173.40 (1.13%) |
2138.00 |
2120.00 - 2179.60 |
1.3423 times |
Mon 01 September 2025 |
2149.15 (-1.97%) |
2192.85 |
2126.85 - 2198.00 |
1.2762 times |
Fri 29 August 2025 |
2192.25 (0.19%) |
2190.00 |
2146.85 - 2203.90 |
1.3524 times |
Thu 28 August 2025 |
2188.00 (1.42%) |
2138.55 |
2108.40 - 2194.00 |
0.7076 times |
Tue 26 August 2025 |
2157.45 (-1.28%) |
2184.35 |
2134.40 - 2187.50 |
0.4682 times |
Mon 25 August 2025 |
2185.40 (0.83%) |
2188.95 |
2170.75 - 2206.00 |
0.4548 times |
Fri 22 August 2025 |
2167.50 (0.64%) |
2154.15 |
2148.30 - 2173.00 |
0.8827 times |
Thu 21 August 2025 |
2153.65 (-0.96%) |
2180.05 |
2135.20 - 2183.75 |
0.4705 times |
Wed 20 August 2025 |
2174.50 (1.42%) |
2155.00 |
2130.10 - 2192.70 |
1.6227 times |
Tue 19 August 2025 |
2144.00 (-0.94%) |
2170.00 |
2122.00 - 2170.00 |
0.5156 times |
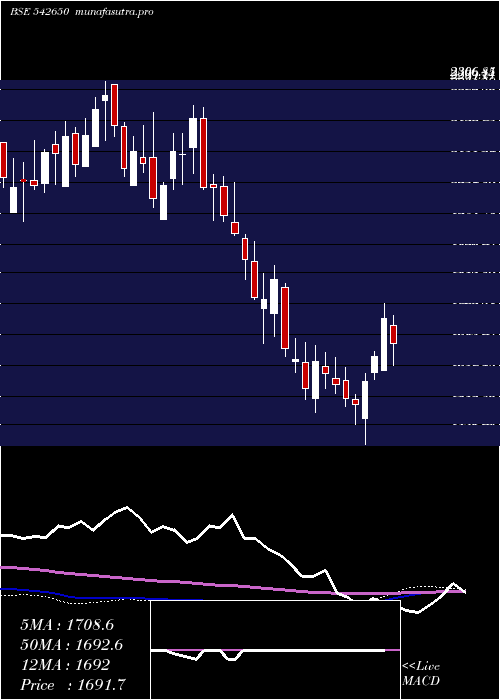
Weekly price and charts Metropolis Strong weekly Stock price targets for Metropolis 542650 are 2163.38 and 2302.68 | Weekly Target 1 | 2056.05 | | Weekly Target 2 | 2131.4 | | Weekly Target 3 | 2195.35 | | Weekly Target 4 | 2270.7 | | Weekly Target 5 | 2334.65 |
Weekly price and volumes for Metropolis
| Date |
Closing |
Open |
Range |
Volume |
Wed 03 September 2025 |
2206.75 (0.66%) |
2192.85 |
2120.00 - 2259.30 |
0.3272 times |
Fri 29 August 2025 |
2192.25 (1.14%) |
2188.95 |
2108.40 - 2206.00 |
0.2415 times |
Fri 22 August 2025 |
2167.50 (2.24%) |
2124.00 |
2067.60 - 2192.70 |
0.3527 times |
Thu 14 August 2025 |
2120.00 (5.45%) |
2010.35 |
2010.35 - 2157.05 |
0.7492 times |
Fri 08 August 2025 |
2010.35 (-1.26%) |
2055.30 |
1966.25 - 2069.55 |
0.3677 times |
Fri 01 August 2025 |
2035.95 (3.44%) |
1960.95 |
1908.70 - 2044.00 |
0.5208 times |
Fri 25 July 2025 |
1968.25 (1.6%) |
1946.80 |
1926.85 - 2062.10 |
1.1136 times |
Fri 18 July 2025 |
1937.20 (2.85%) |
1860.05 |
1828.95 - 2028.40 |
2.7486 times |
Fri 11 July 2025 |
1883.50 (6.18%) |
1773.90 |
1773.90 - 2105.55 |
3.2517 times |
Fri 04 July 2025 |
1773.90 (5.07%) |
1689.05 |
1689.05 - 1785.00 |
0.3269 times |
Fri 27 June 2025 |
1688.25 (0.11%) |
1700.15 |
1680.30 - 1711.00 |
6.6513 times |
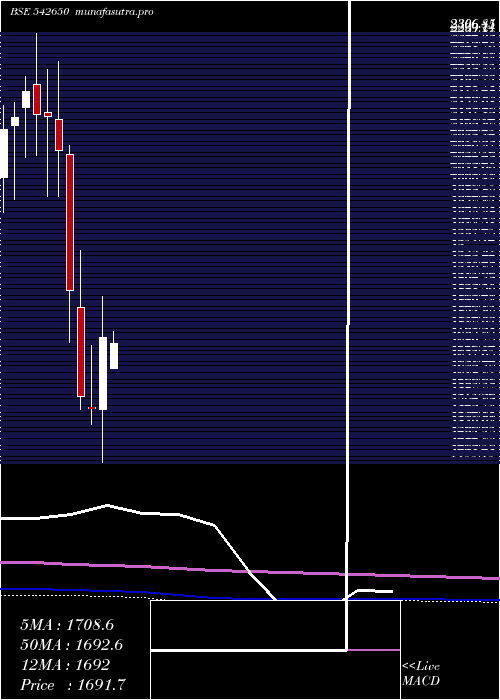
Monthly price and charts Metropolis Strong monthly Stock price targets for Metropolis 542650 are 2163.38 and 2302.68 | Monthly Target 1 | 2056.05 | | Monthly Target 2 | 2131.4 | | Monthly Target 3 | 2195.35 | | Monthly Target 4 | 2270.7 | | Monthly Target 5 | 2334.65 |
Monthly price and volumes Metropolis
| Date |
Closing |
Open |
Range |
Volume |
Wed 03 September 2025 |
2206.75 (0.66%) |
2192.85 |
2120.00 - 2259.30 |
0.0987 times |
Fri 29 August 2025 |
2192.25 (9.75%) |
1995.35 |
1966.25 - 2206.00 |
0.5686 times |
Thu 31 July 2025 |
1997.45 (16.9%) |
1704.60 |
1693.10 - 2105.55 |
2.3359 times |
Mon 30 June 2025 |
1708.65 (1.61%) |
1652.00 |
1644.20 - 1779.75 |
2.3403 times |
Fri 30 May 2025 |
1681.60 (-1.23%) |
1641.05 |
1590.00 - 1749.85 |
0.4301 times |
Wed 30 April 2025 |
1702.55 (8.96%) |
1560.00 |
1455.15 - 1785.00 |
0.324 times |
Fri 28 March 2025 |
1562.60 (-1.52%) |
1564.10 |
1530.10 - 1687.30 |
0.6222 times |
Fri 28 February 2025 |
1586.75 (-11.65%) |
1763.05 |
1560.65 - 1876.00 |
1.5268 times |
Fri 31 January 2025 |
1796.00 (-13.41%) |
2065.45 |
1692.55 - 2083.20 |
0.8538 times |
Tue 31 December 2024 |
2074.15 (-3.18%) |
2135.55 |
1982.00 - 2250.00 |
0.8996 times |
Fri 29 November 2024 |
2142.30 (-0.12%) |
2150.00 |
1983.25 - 2235.00 |
0.4955 times |
DMA SMA EMA moving averages of Metropolis 542650
DMA (daily moving average) of Metropolis 542650
| DMA period | DMA value | | 5 day DMA | 2181.91 | | 12 day DMA | 2171.37 | | 20 day DMA | 2126.55 | | 35 day DMA | 2062.61 | | 50 day DMA | 1982.97 | | 100 day DMA | 1829.44 | | 150 day DMA | 1784.13 | | 200 day DMA | 1858.42 | EMA (exponential moving average) of Metropolis 542650
| EMA period | EMA current | EMA prev | EMA prev2 | | 5 day EMA | 2182.19 | 2169.91 | 2168.16 | | 12 day EMA | 2159.69 | 2151.14 | 2147.09 | | 20 day EMA | 2125.42 | 2116.86 | 2110.91 | | 35 day EMA | 2053.42 | 2044.39 | 2036.79 | | 50 day EMA | 1979.53 | 1970.26 | 1961.97 |
SMA (simple moving average) of Metropolis 542650
| SMA period | SMA current | SMA prev | SMA prev2 | | 5 day SMA | 2181.91 | 2172.05 | 2174.45 | | 12 day SMA | 2171.37 | 2164.14 | 2160.25 | | 20 day SMA | 2126.55 | 2118.05 | 2111.17 | | 35 day SMA | 2062.61 | 2053.23 | 2044.95 | | 50 day SMA | 1982.97 | 1972.91 | 1963.17 | | 100 day SMA | 1829.44 | 1822.91 | 1816.45 | | 150 day SMA | 1784.13 | 1782 | 1780.02 | | 200 day SMA | 1858.42 | 1857.89 | 1857.74 |
|
|
