Chandnimach 542627 full analysis,charts,indicators,moving averages,SMA,DMA,EMA,ADX,MACD,RSIChandnimach 542627 WideScreen charts, DMA,SMA,EMA technical analysis, forecast prediction, by indicators ADX,MACD,RSI,CCI BSE stock exchange
Daily price and charts and targets Chandnimach Strong Daily Stock price targets for Chandnimach 542627 are 42.71 and 50.92 | Daily Target 1 | 35.86 | | Daily Target 2 | 41.34 | | Daily Target 3 | 44.073333333333 | | Daily Target 4 | 49.55 | | Daily Target 5 | 52.28 |
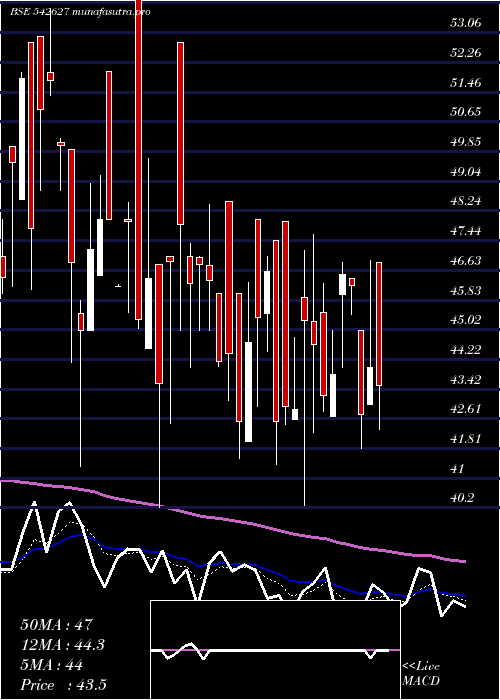
Daily price and volume Chandnimach
| Date |
Closing |
Open |
Range |
Volume |
Thu 23 October 2025 |
46.81 (19.99%) |
39.97 |
38.60 - 46.81 |
5.4406 times |
Tue 21 October 2025 |
39.01 (9.42%) |
41.00 |
36.50 - 41.03 |
0.9129 times |
Mon 20 October 2025 |
35.65 (1.05%) |
35.00 |
35.00 - 41.49 |
0.0808 times |
Fri 17 October 2025 |
35.28 (0.8%) |
37.00 |
34.00 - 40.74 |
0.1348 times |
Thu 16 October 2025 |
35.00 (1.36%) |
34.50 |
34.50 - 36.49 |
0.1233 times |
Wed 15 October 2025 |
34.53 (0.76%) |
33.51 |
33.51 - 35.50 |
0.348 times |
Tue 14 October 2025 |
34.27 (-3.76%) |
37.00 |
34.00 - 37.50 |
0.3502 times |
Mon 13 October 2025 |
35.61 (-0.59%) |
35.20 |
33.40 - 37.44 |
0.3005 times |
Fri 10 October 2025 |
35.82 (-6.03%) |
37.60 |
35.04 - 38.85 |
1.3531 times |
Thu 09 October 2025 |
38.12 (-3.37%) |
41.84 |
37.60 - 41.84 |
0.9557 times |
Wed 08 October 2025 |
39.45 (3.33%) |
42.89 |
38.28 - 42.89 |
1.2524 times |
Weekly price and charts Chandnimach Strong weekly Stock price targets for Chandnimach 542627 are 40.91 and 52.72 | Weekly Target 1 | 31.06 | | Weekly Target 2 | 38.94 | | Weekly Target 3 | 42.873333333333 | | Weekly Target 4 | 50.75 | | Weekly Target 5 | 54.68 |
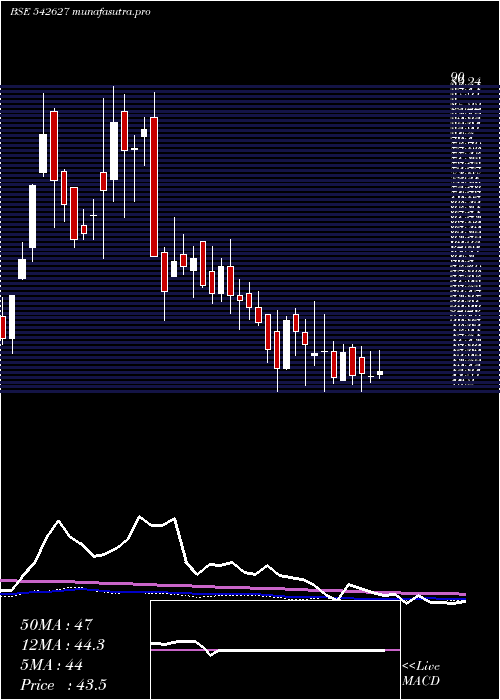
Weekly price and volumes for Chandnimach
| Date |
Closing |
Open |
Range |
Volume |
Thu 23 October 2025 |
46.81 (32.68%) |
35.00 |
35.00 - 46.81 |
2.6152 times |
Fri 17 October 2025 |
35.28 (-1.51%) |
35.20 |
33.40 - 40.74 |
0.5109 times |
Fri 10 October 2025 |
35.82 (4.86%) |
33.08 |
33.08 - 42.89 |
2.0228 times |
Fri 03 October 2025 |
34.16 (0.59%) |
33.75 |
31.00 - 36.95 |
0.9231 times |
Fri 26 September 2025 |
33.96 (-7.42%) |
39.69 |
33.10 - 39.69 |
0.5937 times |
Fri 19 September 2025 |
36.68 (11.9%) |
32.79 |
31.58 - 37.90 |
1.2587 times |
Fri 12 September 2025 |
32.78 (-5.91%) |
34.14 |
32.11 - 36.50 |
0.7011 times |
Fri 05 September 2025 |
34.84 (-3.09%) |
37.99 |
33.10 - 37.99 |
0.6498 times |
Fri 29 August 2025 |
35.95 (-4.13%) |
38.43 |
34.02 - 38.43 |
0.2774 times |
Fri 22 August 2025 |
37.50 (3.45%) |
38.74 |
35.00 - 38.74 |
0.4475 times |
Thu 14 August 2025 |
36.25 (-0.77%) |
35.36 |
35.36 - 38.70 |
0.5558 times |
Monthly price and charts Chandnimach Strong monthly Stock price targets for Chandnimach 542627 are 38.91 and 54.72 | Monthly Target 1 | 25.73 | | Monthly Target 2 | 36.27 | | Monthly Target 3 | 41.54 | | Monthly Target 4 | 52.08 | | Monthly Target 5 | 57.35 |
Monthly price and volumes Chandnimach
| Date |
Closing |
Open |
Range |
Volume |
Thu 23 October 2025 |
46.81 (40.32%) |
33.36 |
31.00 - 46.81 |
1.3876 times |
Tue 30 September 2025 |
33.36 (-7.2%) |
37.99 |
31.58 - 39.69 |
0.7978 times |
Fri 29 August 2025 |
35.95 (-8.06%) |
44.39 |
34.02 - 44.39 |
0.4044 times |
Thu 31 July 2025 |
39.10 (-7.7%) |
42.57 |
38.60 - 43.97 |
1.0621 times |
Mon 30 June 2025 |
42.36 (-5.3%) |
44.73 |
40.55 - 46.99 |
0.6425 times |
Fri 30 May 2025 |
44.73 (4.12%) |
44.04 |
36.01 - 51.00 |
0.9345 times |
Wed 30 April 2025 |
42.96 (0.99%) |
42.00 |
40.25 - 48.00 |
0.4743 times |
Fri 28 March 2025 |
42.54 (-14.92%) |
49.90 |
40.20 - 54.98 |
1.8499 times |
Fri 28 February 2025 |
50.00 (-2.89%) |
52.90 |
40.32 - 53.73 |
1.1919 times |
Fri 31 January 2025 |
51.49 (-11.71%) |
59.49 |
50.35 - 65.00 |
1.2551 times |
Tue 31 December 2024 |
58.32 (-5.02%) |
62.63 |
54.70 - 65.89 |
1.4864 times |

DMA SMA EMA moving averages of Chandnimach 542627
DMA (daily moving average) of Chandnimach 542627
| DMA period | DMA value | | 5 day DMA | 38.35 | | 12 day DMA | 37.31 | | 20 day DMA | 36.31 | | 35 day DMA | 35.74 | | 50 day DMA | 35.95 | | 100 day DMA | 38.62 | | 150 day DMA | 40.59 | | 200 day DMA | 43.4 | EMA (exponential moving average) of Chandnimach 542627
| EMA period | EMA current | EMA prev | EMA prev2 | | 5 day EMA | 40 | 36.59 | 35.38 | | 12 day EMA | 37.75 | 36.1 | 35.57 | | 20 day EMA | 36.97 | 35.94 | 35.62 | | 35 day EMA | 36.53 | 35.92 | 35.74 | | 50 day EMA | 36.38 | 35.95 | 35.83 |
SMA (simple moving average) of Chandnimach 542627
| SMA period | SMA current | SMA prev | SMA prev2 | | 5 day SMA | 38.35 | 35.89 | 34.95 | | 12 day SMA | 37.31 | 36.45 | 36.05 | | 20 day SMA | 36.31 | 35.87 | 35.87 | | 35 day SMA | 35.74 | 35.38 | 35.27 | | 50 day SMA | 35.95 | 35.74 | 35.73 | | 100 day SMA | 38.62 | 38.59 | 38.63 | | 150 day SMA | 40.59 | 40.6 | 40.65 | | 200 day SMA | 43.4 | 43.45 | 43.56 |
|
|
