Nivaka 542206 full analysis,charts,indicators,moving averages,SMA,DMA,EMA,ADX,MACD,RSINivaka 542206 WideScreen charts, DMA,SMA,EMA technical analysis, forecast prediction, by indicators ADX,MACD,RSI,CCI BSE stock exchange
Daily price and charts and targets Nivaka Strong Daily Stock price targets for Nivaka 542206 are 3.7 and 3.7 | Daily Target 1 | 3.7 | | Daily Target 2 | 3.7 | | Daily Target 3 | 3.7 | | Daily Target 4 | 3.7 | | Daily Target 5 | 3.7 |
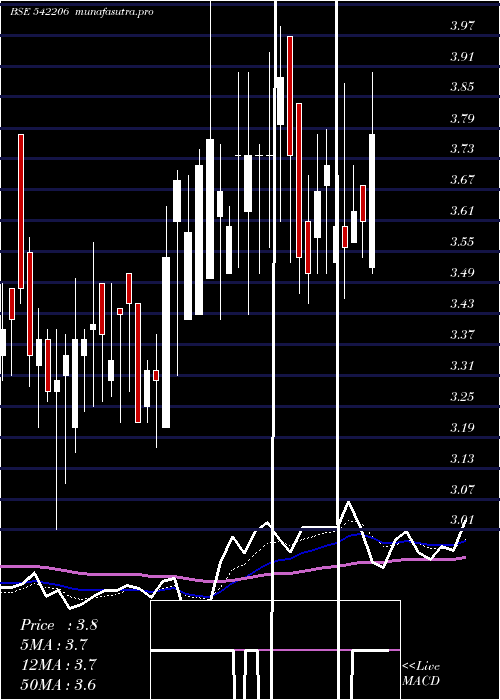
Daily price and volume Nivaka
| Date |
Closing |
Open |
Range |
Volume |
Tue 21 October 2025 |
3.70 (4.82%) |
3.70 |
3.70 - 3.70 |
0.7687 times |
Mon 20 October 2025 |
3.53 (4.75%) |
3.53 |
3.53 - 3.53 |
0.3096 times |
Fri 17 October 2025 |
3.37 (4.98%) |
3.37 |
3.37 - 3.37 |
0.4662 times |
Thu 16 October 2025 |
3.21 (4.9%) |
3.21 |
3.21 - 3.21 |
0.7034 times |
Wed 15 October 2025 |
3.06 (4.79%) |
3.06 |
3.06 - 3.06 |
0.7165 times |
Tue 14 October 2025 |
2.92 (4.66%) |
2.92 |
2.92 - 2.92 |
0.7322 times |
Mon 13 October 2025 |
2.79 (4.89%) |
2.79 |
2.79 - 2.79 |
2.6438 times |
Fri 10 October 2025 |
2.66 (-4.32%) |
2.66 |
2.66 - 2.66 |
0.398 times |
Wed 08 October 2025 |
2.78 (-4.79%) |
2.78 |
2.78 - 2.78 |
2.4512 times |
Tue 07 October 2025 |
2.92 (-4.89%) |
2.92 |
2.92 - 2.92 |
0.8104 times |
Mon 06 October 2025 |
3.07 (-4.95%) |
3.23 |
3.07 - 3.23 |
0.6109 times |
Weekly price and charts Nivaka Strong weekly Stock price targets for Nivaka 542206 are 3.62 and 3.79 | Weekly Target 1 | 3.47 | | Weekly Target 2 | 3.59 | | Weekly Target 3 | 3.6433333333333 | | Weekly Target 4 | 3.76 | | Weekly Target 5 | 3.81 |
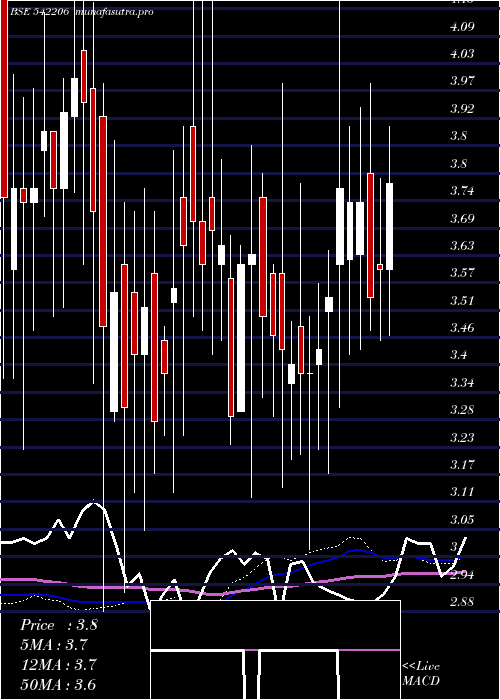
Weekly price and volumes for Nivaka
| Date |
Closing |
Open |
Range |
Volume |
Tue 21 October 2025 |
3.70 (9.79%) |
3.53 |
3.53 - 3.70 |
0.0608 times |
Fri 17 October 2025 |
3.37 (26.69%) |
2.79 |
2.79 - 3.37 |
0.2967 times |
Fri 10 October 2025 |
2.66 (-17.65%) |
3.23 |
2.66 - 3.23 |
0.2408 times |
Fri 03 October 2025 |
3.23 (-8.76%) |
3.47 |
3.23 - 3.57 |
0.3502 times |
Fri 26 September 2025 |
3.54 (-6.1%) |
3.67 |
3.54 - 3.77 |
0.0405 times |
Fri 19 September 2025 |
3.77 (-17.14%) |
4.35 |
3.77 - 4.77 |
0.2269 times |
Fri 12 September 2025 |
4.55 (-6.38%) |
5.10 |
4.29 - 5.20 |
1.4497 times |
Fri 05 September 2025 |
4.86 (23.35%) |
4.12 |
3.81 - 4.86 |
3.6287 times |
Fri 29 August 2025 |
3.94 (-5.52%) |
4.17 |
3.78 - 4.37 |
1.6817 times |
Fri 22 August 2025 |
4.17 (13.32%) |
3.50 |
3.50 - 4.21 |
2.024 times |
Thu 14 August 2025 |
3.68 (3.08%) |
3.50 |
3.42 - 3.74 |
1.0643 times |
Monthly price and charts Nivaka Strong monthly Stock price targets for Nivaka 542206 are 3.18 and 4.22 | Monthly Target 1 | 2.31 | | Monthly Target 2 | 3.01 | | Monthly Target 3 | 3.3533333333333 | | Monthly Target 4 | 4.05 | | Monthly Target 5 | 4.39 |
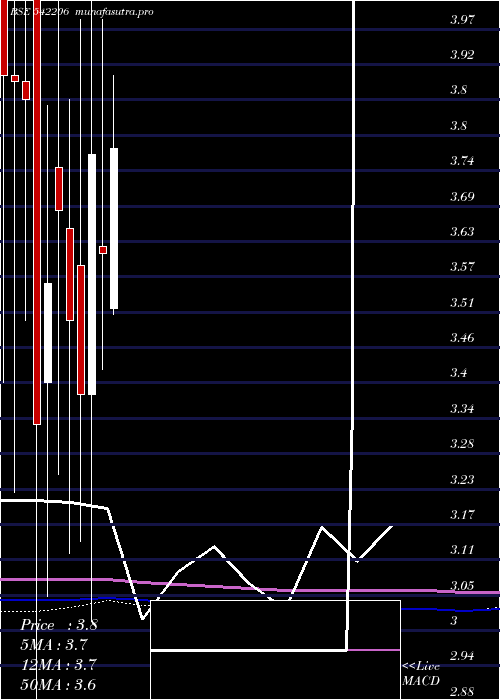
Monthly price and volumes Nivaka
| Date |
Closing |
Open |
Range |
Volume |
Tue 21 October 2025 |
3.70 (3.64%) |
3.40 |
2.66 - 3.70 |
0.0293 times |
Tue 30 September 2025 |
3.57 (-9.39%) |
4.12 |
3.23 - 5.20 |
0.2613 times |
Fri 29 August 2025 |
3.94 (-0.25%) |
3.81 |
3.42 - 4.37 |
0.9756 times |
Thu 31 July 2025 |
3.95 (13.18%) |
3.52 |
3.40 - 5.37 |
3.5084 times |
Mon 30 June 2025 |
3.49 (-2.79%) |
3.57 |
3.13 - 4.05 |
0.0984 times |
Fri 30 May 2025 |
3.59 (-0.55%) |
3.52 |
3.15 - 3.90 |
0.1641 times |
Wed 30 April 2025 |
3.61 (-4.24%) |
3.62 |
3.42 - 3.99 |
0.9051 times |
Fri 28 March 2025 |
3.77 (11.54%) |
3.38 |
3.01 - 4.30 |
2.3338 times |
Fri 28 February 2025 |
3.38 (-3.43%) |
3.59 |
3.14 - 3.99 |
0.1034 times |
Fri 31 January 2025 |
3.50 (-4.89%) |
3.65 |
3.12 - 3.86 |
1.6205 times |
Tue 31 December 2024 |
3.68 (3.37%) |
3.75 |
3.25 - 4.32 |
0.3571 times |
DMA SMA EMA moving averages of Nivaka 542206
DMA (daily moving average) of Nivaka 542206
| DMA period | DMA value | | 5 day DMA | 3.37 | | 12 day DMA | 3.1 | | 20 day DMA | 3.29 | | 35 day DMA | 3.78 | | 50 day DMA | 3.79 | | 100 day DMA | 3.73 | | 150 day DMA | 3.67 | | 200 day DMA | 3.63 | EMA (exponential moving average) of Nivaka 542206
| EMA period | EMA current | EMA prev | EMA prev2 | | 5 day EMA | 3.42 | 3.28 | 3.15 | | 12 day EMA | 3.3 | 3.23 | 3.18 | | 20 day EMA | 3.39 | 3.36 | 3.34 | | 35 day EMA | 3.51 | 3.5 | 3.5 | | 50 day EMA | 3.77 | 3.77 | 3.78 |
SMA (simple moving average) of Nivaka 542206
| SMA period | SMA current | SMA prev | SMA prev2 | | 5 day SMA | 3.37 | 3.22 | 3.07 | | 12 day SMA | 3.1 | 3.08 | 3.08 | | 20 day SMA | 3.29 | 3.3 | 3.34 | | 35 day SMA | 3.78 | 3.79 | 3.81 | | 50 day SMA | 3.79 | 3.79 | 3.8 | | 100 day SMA | 3.73 | 3.73 | 3.73 | | 150 day SMA | 3.67 | 3.66 | 3.66 | | 200 day SMA | 3.63 | 3.63 | 3.63 |
|
|
