Grse 542011 full analysis,charts,indicators,moving averages,SMA,DMA,EMA,ADX,MACD,RSIGrse 542011 WideScreen charts, DMA,SMA,EMA technical analysis, forecast prediction, by indicators ADX,MACD,RSI,CCI BSE stock exchange
Daily price and charts and targets Grse Strong Daily Stock price targets for Grse 542011 are 2630.95 and 2648.5 | Daily Target 1 | 2627.12 | | Daily Target 2 | 2634.78 | | Daily Target 3 | 2644.6666666667 | | Daily Target 4 | 2652.33 | | Daily Target 5 | 2662.22 |
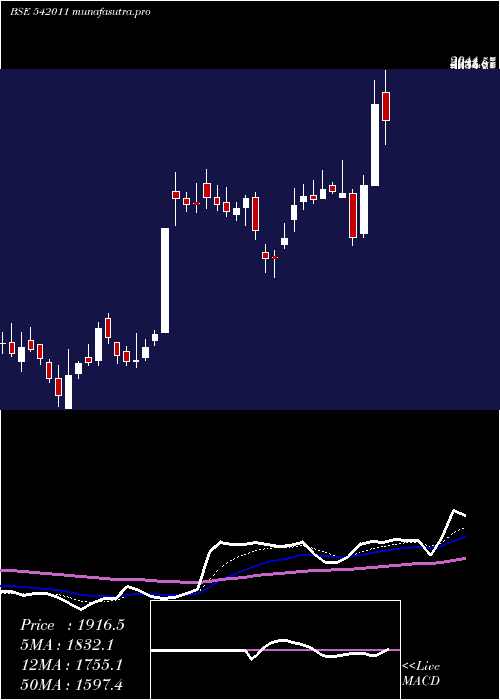
Daily price and volume Grse
| Date |
Closing |
Open |
Range |
Volume |
Tue 21 October 2025 |
2642.45 (0.2%) |
2647.85 |
2637.00 - 2654.55 |
0.2722 times |
Mon 20 October 2025 |
2637.20 (1.53%) |
2610.00 |
2599.00 - 2641.00 |
0.9191 times |
Fri 17 October 2025 |
2597.50 (-0.66%) |
2601.20 |
2590.00 - 2669.90 |
1.0848 times |
Thu 16 October 2025 |
2614.75 (-0.21%) |
2628.80 |
2590.00 - 2641.40 |
0.8104 times |
Wed 15 October 2025 |
2620.35 (2.26%) |
2565.35 |
2544.50 - 2636.00 |
1.0062 times |
Tue 14 October 2025 |
2562.55 (-1.67%) |
2615.00 |
2552.00 - 2635.00 |
1.2254 times |
Mon 13 October 2025 |
2606.20 (-2.03%) |
2659.95 |
2602.00 - 2659.95 |
1.0065 times |
Fri 10 October 2025 |
2660.15 (-2.28%) |
2729.05 |
2653.15 - 2773.25 |
1.4106 times |
Thu 09 October 2025 |
2722.35 (1.44%) |
2704.85 |
2675.00 - 2734.00 |
1.0635 times |
Wed 08 October 2025 |
2683.75 (-1.02%) |
2712.20 |
2662.90 - 2736.45 |
1.2013 times |
Tue 07 October 2025 |
2711.45 (-1.18%) |
2746.15 |
2700.00 - 2782.40 |
0.583 times |
Weekly price and charts Grse Strong weekly Stock price targets for Grse 542011 are 2620.73 and 2676.28 | Weekly Target 1 | 2576.45 | | Weekly Target 2 | 2609.45 | | Weekly Target 3 | 2632 | | Weekly Target 4 | 2665 | | Weekly Target 5 | 2687.55 |
Weekly price and volumes for Grse
| Date |
Closing |
Open |
Range |
Volume |
Tue 21 October 2025 |
2642.45 (1.73%) |
2610.00 |
2599.00 - 2654.55 |
0.1735 times |
Fri 17 October 2025 |
2597.50 (-2.36%) |
2659.95 |
2544.50 - 2669.90 |
0.7477 times |
Fri 10 October 2025 |
2660.15 (-2.38%) |
2717.30 |
2653.15 - 2792.00 |
0.8834 times |
Fri 03 October 2025 |
2725.05 (4.36%) |
2639.85 |
2481.50 - 2745.00 |
0.998 times |
Fri 26 September 2025 |
2611.30 (0.28%) |
2698.55 |
2604.85 - 2830.00 |
1.4097 times |
Fri 19 September 2025 |
2604.10 (0.57%) |
2586.95 |
2430.00 - 2727.50 |
2.3681 times |
Fri 12 September 2025 |
2589.40 (7.55%) |
2412.20 |
2350.05 - 2592.60 |
1.3896 times |
Fri 05 September 2025 |
2407.60 (2.27%) |
2355.35 |
2355.35 - 2590.00 |
0.7817 times |
Fri 29 August 2025 |
2354.05 (-7.79%) |
2560.30 |
2324.05 - 2614.45 |
0.4878 times |
Fri 22 August 2025 |
2552.95 (-1.4%) |
2620.15 |
2546.00 - 2718.00 |
0.7605 times |
Thu 14 August 2025 |
2589.20 (2.75%) |
2499.50 |
2465.00 - 2685.00 |
0.7221 times |

Monthly price and charts Grse Strong monthly Stock price targets for Grse 542011 are 2579.45 and 2855 | Monthly Target 1 | 2374.75 | | Monthly Target 2 | 2508.6 | | Monthly Target 3 | 2650.3 | | Monthly Target 4 | 2784.15 | | Monthly Target 5 | 2925.85 |
Monthly price and volumes Grse
| Date |
Closing |
Open |
Range |
Volume |
Tue 21 October 2025 |
2642.45 (4.44%) |
2527.35 |
2516.45 - 2792.00 |
0.4056 times |
Tue 30 September 2025 |
2530.00 (7.47%) |
2355.35 |
2350.05 - 2830.00 |
0.9641 times |
Fri 29 August 2025 |
2354.05 (-9.91%) |
2613.45 |
2324.05 - 2718.00 |
0.415 times |
Thu 31 July 2025 |
2613.05 (-13.36%) |
3019.25 |
2424.00 - 3062.00 |
0.6598 times |
Mon 30 June 2025 |
3015.95 (0.32%) |
3006.30 |
2852.65 - 3535.00 |
2.5115 times |
Fri 30 May 2025 |
3006.35 (56.87%) |
1929.70 |
1741.20 - 3143.00 |
2.8874 times |
Wed 30 April 2025 |
1916.50 (13.78%) |
1675.70 |
1514.55 - 2044.00 |
1.0521 times |
Fri 28 March 2025 |
1684.45 (34.08%) |
1257.25 |
1180.10 - 1790.00 |
0.5447 times |
Fri 28 February 2025 |
1256.30 (-22.68%) |
1570.00 |
1201.20 - 1589.80 |
0.2798 times |
Fri 31 January 2025 |
1624.75 (0.44%) |
1610.05 |
1352.95 - 1680.75 |
0.2801 times |
Tue 31 December 2024 |
1617.65 (-3.61%) |
1654.05 |
1525.70 - 1828.80 |
0.298 times |

DMA SMA EMA moving averages of Grse 542011
DMA (daily moving average) of Grse 542011
| DMA period | DMA value | | 5 day DMA | 2622.45 | | 12 day DMA | 2650.22 | | 20 day DMA | 2645.95 | | 35 day DMA | 2579.75 | | 50 day DMA | 2563.77 | | 100 day DMA | 2730.84 | | 150 day DMA | 2440 | | 200 day DMA | 2197.36 | EMA (exponential moving average) of Grse 542011
| EMA period | EMA current | EMA prev | EMA prev2 | | 5 day EMA | 2628.4 | 2621.37 | 2613.45 | | 12 day EMA | 2630.76 | 2628.64 | 2627.08 | | 20 day EMA | 2623.48 | 2621.48 | 2619.83 | | 35 day EMA | 2603.62 | 2601.33 | 2599.22 | | 50 day EMA | 2572.67 | 2569.82 | 2567.07 |
SMA (simple moving average) of Grse 542011
| SMA period | SMA current | SMA prev | SMA prev2 | | 5 day SMA | 2622.45 | 2606.47 | 2600.27 | | 12 day SMA | 2650.22 | 2657.1 | 2657.76 | | 20 day SMA | 2645.95 | 2647.18 | 2645.53 | | 35 day SMA | 2579.75 | 2575.29 | 2567.2 | | 50 day SMA | 2563.77 | 2561.8 | 2561 | | 100 day SMA | 2730.84 | 2733.33 | 2735.11 | | 150 day SMA | 2440 | 2431.01 | 2421.86 | | 200 day SMA | 2197.36 | 2191.93 | 2186.61 |
|
|
