Manorama 541974 full analysis,charts,indicators,moving averages,SMA,DMA,EMA,ADX,MACD,RSIManorama 541974 WideScreen charts, DMA,SMA,EMA technical analysis, forecast prediction, by indicators ADX,MACD,RSI,CCI BSE stock exchange
Daily price and charts and targets Manorama Strong Daily Stock price targets for Manorama 541974 are 1279.65 and 1357.1 | Daily Target 1 | 1263.47 | | Daily Target 2 | 1295.83 | | Daily Target 3 | 1340.9166666667 | | Daily Target 4 | 1373.28 | | Daily Target 5 | 1418.37 |
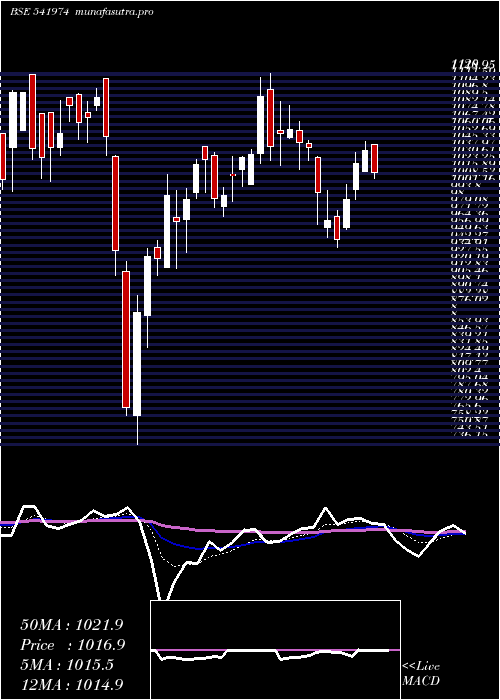
Daily price and volume Manorama
| Date |
Closing |
Open |
Range |
Volume |
Wed 03 September 2025 |
1328.20 (-0.3%) |
1347.90 |
1308.55 - 1386.00 |
1.6426 times |
Tue 02 September 2025 |
1332.25 (0.68%) |
1328.00 |
1317.20 - 1356.70 |
0.5501 times |
Mon 01 September 2025 |
1323.20 (-2.31%) |
1346.05 |
1319.10 - 1369.25 |
0.3447 times |
Fri 29 August 2025 |
1354.45 (0.01%) |
1370.00 |
1348.00 - 1381.55 |
0.4137 times |
Thu 28 August 2025 |
1354.35 (-1.32%) |
1370.00 |
1345.00 - 1380.80 |
1.2626 times |
Tue 26 August 2025 |
1372.45 (-1.85%) |
1415.00 |
1362.75 - 1415.00 |
0.3751 times |
Mon 25 August 2025 |
1398.35 (-1.16%) |
1422.70 |
1394.05 - 1430.35 |
1.2594 times |
Fri 22 August 2025 |
1414.80 (1.04%) |
1386.55 |
1386.55 - 1428.90 |
1.084 times |
Thu 21 August 2025 |
1400.25 (-0.72%) |
1425.00 |
1390.00 - 1425.00 |
1.6446 times |
Wed 20 August 2025 |
1410.45 (-0.06%) |
1405.00 |
1386.95 - 1444.85 |
1.4232 times |
Tue 19 August 2025 |
1411.30 (1.55%) |
1390.60 |
1374.80 - 1420.00 |
0.5602 times |
Weekly price and charts Manorama Strong weekly Stock price targets for Manorama 541974 are 1279.65 and 1357.1 | Weekly Target 1 | 1263.47 | | Weekly Target 2 | 1295.83 | | Weekly Target 3 | 1340.9166666667 | | Weekly Target 4 | 1373.28 | | Weekly Target 5 | 1418.37 |
Weekly price and volumes for Manorama
| Date |
Closing |
Open |
Range |
Volume |
Wed 03 September 2025 |
1328.20 (-1.94%) |
1346.05 |
1308.55 - 1386.00 |
0.3948 times |
Fri 29 August 2025 |
1354.45 (-4.27%) |
1422.70 |
1345.00 - 1430.35 |
0.5152 times |
Fri 22 August 2025 |
1414.80 (2.71%) |
1366.65 |
1366.65 - 1444.85 |
0.9013 times |
Thu 14 August 2025 |
1377.45 (-0.84%) |
1375.00 |
1346.80 - 1410.70 |
0.4101 times |
Fri 08 August 2025 |
1389.10 (-6.58%) |
1518.95 |
1380.70 - 1518.95 |
0.8775 times |
Fri 01 August 2025 |
1486.95 (-5.42%) |
1658.55 |
1475.10 - 1774.00 |
3.9594 times |
Fri 25 July 2025 |
1572.20 (0.85%) |
1589.85 |
1529.90 - 1632.00 |
0.8784 times |
Fri 18 July 2025 |
1558.95 (6.23%) |
1459.05 |
1423.95 - 1617.15 |
0.9117 times |
Fri 11 July 2025 |
1467.55 (-0.39%) |
1470.05 |
1452.00 - 1554.00 |
0.7757 times |
Fri 04 July 2025 |
1473.35 (1.65%) |
1444.25 |
1390.65 - 1513.00 |
0.3758 times |
Fri 27 June 2025 |
1449.45 (5.66%) |
1345.05 |
1309.40 - 1463.00 |
0.7449 times |

Monthly price and charts Manorama Strong monthly Stock price targets for Manorama 541974 are 1279.65 and 1357.1 | Monthly Target 1 | 1263.47 | | Monthly Target 2 | 1295.83 | | Monthly Target 3 | 1340.9166666667 | | Monthly Target 4 | 1373.28 | | Monthly Target 5 | 1418.37 |
Monthly price and volumes Manorama
| Date |
Closing |
Open |
Range |
Volume |
Wed 03 September 2025 |
1328.20 (-1.94%) |
1346.05 |
1308.55 - 1386.00 |
0.0748 times |
Fri 29 August 2025 |
1354.45 (-10.4%) |
1512.05 |
1345.00 - 1537.00 |
0.5547 times |
Thu 31 July 2025 |
1511.70 (3.39%) |
1462.15 |
1390.65 - 1774.00 |
1.2574 times |
Mon 30 June 2025 |
1462.20 (0.2%) |
1462.25 |
1309.40 - 1480.15 |
0.3943 times |
Fri 30 May 2025 |
1459.35 (14.52%) |
1301.35 |
1140.45 - 1519.95 |
0.6579 times |
Wed 30 April 2025 |
1274.30 (19.96%) |
1061.25 |
939.95 - 1388.25 |
0.6675 times |
Fri 28 March 2025 |
1062.30 (13.4%) |
914.95 |
736.15 - 1120.00 |
0.3479 times |
Fri 28 February 2025 |
936.80 (-11.18%) |
1051.05 |
911.00 - 1118.95 |
0.2595 times |
Fri 31 January 2025 |
1054.75 (-1.69%) |
1093.95 |
959.05 - 1130.95 |
0.4488 times |
Tue 31 December 2024 |
1072.85 (-8.8%) |
1223.95 |
1045.50 - 1250.75 |
5.3371 times |
Fri 29 November 2024 |
1176.35 (19.66%) |
1004.00 |
959.75 - 1240.00 |
0.5979 times |

DMA SMA EMA moving averages of Manorama 541974
DMA (daily moving average) of Manorama 541974
| DMA period | DMA value | | 5 day DMA | 1338.49 | | 12 day DMA | 1374.15 | | 20 day DMA | 1380.15 | | 35 day DMA | 1459.21 | | 50 day DMA | 1456.77 | | 100 day DMA | 1380.74 | | 150 day DMA | 1264.17 | | 200 day DMA | 1222.44 | EMA (exponential moving average) of Manorama 541974
| EMA period | EMA current | EMA prev | EMA prev2 | | 5 day EMA | 1341.12 | 1347.58 | 1355.24 | | 12 day EMA | 1365.88 | 1372.73 | 1380.09 | | 20 day EMA | 1388.91 | 1395.3 | 1401.93 | | 35 day EMA | 1410.76 | 1415.62 | 1420.53 | | 50 day EMA | 1439.58 | 1444.12 | 1448.68 |
SMA (simple moving average) of Manorama 541974
| SMA period | SMA current | SMA prev | SMA prev2 | | 5 day SMA | 1338.49 | 1347.34 | 1360.56 | | 12 day SMA | 1374.15 | 1378.25 | 1380.17 | | 20 day SMA | 1380.15 | 1386.53 | 1394.26 | | 35 day SMA | 1459.21 | 1464.45 | 1468.32 | | 50 day SMA | 1456.77 | 1456.63 | 1457.42 | | 100 day SMA | 1380.74 | 1377.89 | 1375.05 | | 150 day SMA | 1264.17 | 1262.45 | 1260.43 | | 200 day SMA | 1222.44 | 1220.71 | 1218.98 |
|
|
