Vivanta 541735 full analysis,charts,indicators,moving averages,SMA,DMA,EMA,ADX,MACD,RSIVivanta 541735 WideScreen charts, DMA,SMA,EMA technical analysis, forecast prediction, by indicators ADX,MACD,RSI,CCI BSE stock exchange
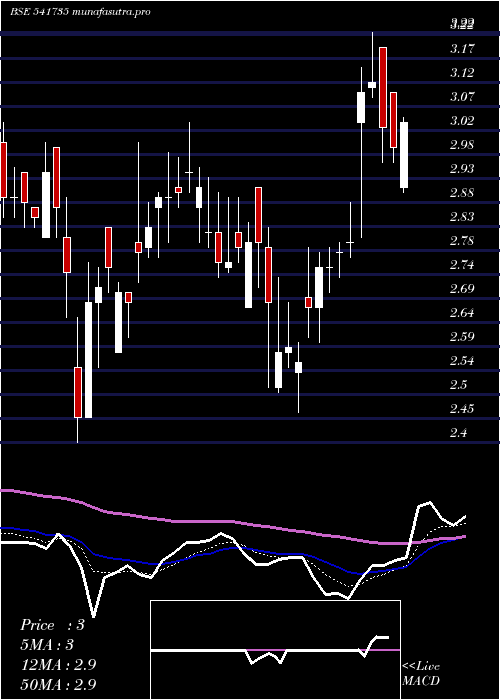
Daily price and charts and targets Vivanta Strong Daily Stock price targets for Vivanta 541735 are 2.39 and 2.55 | Daily Target 1 | 2.28 | | Daily Target 2 | 2.34 | | Daily Target 3 | 2.4366666666667 | | Daily Target 4 | 2.5 | | Daily Target 5 | 2.6 |
Daily price and volume Vivanta
| Date |
Closing |
Open |
Range |
Volume |
Tue 21 October 2025 |
2.41 (0%) |
2.37 |
2.37 - 2.53 |
1.2518 times |
Mon 20 October 2025 |
2.41 (0.84%) |
2.36 |
2.36 - 2.47 |
1.4908 times |
Fri 17 October 2025 |
2.39 (0.42%) |
2.38 |
2.32 - 2.40 |
1.2801 times |
Thu 16 October 2025 |
2.38 (-0.42%) |
2.42 |
2.37 - 2.42 |
0.9766 times |
Wed 15 October 2025 |
2.39 (-0.42%) |
2.38 |
2.38 - 2.44 |
0.9411 times |
Tue 14 October 2025 |
2.40 (-1.23%) |
2.45 |
2.38 - 2.45 |
0.8948 times |
Mon 13 October 2025 |
2.43 (-0.82%) |
2.50 |
2.41 - 2.50 |
0.8538 times |
Fri 10 October 2025 |
2.45 (0.82%) |
2.42 |
2.41 - 2.49 |
1.0868 times |
Thu 09 October 2025 |
2.43 (-0.41%) |
2.44 |
2.40 - 2.46 |
0.6683 times |
Wed 08 October 2025 |
2.44 (0.41%) |
2.49 |
2.43 - 2.49 |
0.5558 times |
Tue 07 October 2025 |
2.43 (-1.62%) |
2.47 |
2.27 - 2.50 |
1.7694 times |
Weekly price and charts Vivanta Strong weekly Stock price targets for Vivanta 541735 are 2.39 and 2.56 | Weekly Target 1 | 2.26 | | Weekly Target 2 | 2.34 | | Weekly Target 3 | 2.4333333333333 | | Weekly Target 4 | 2.51 | | Weekly Target 5 | 2.6 |
Weekly price and volumes for Vivanta
| Date |
Closing |
Open |
Range |
Volume |
Tue 21 October 2025 |
2.41 (0.84%) |
2.36 |
2.36 - 2.53 |
0.5018 times |
Fri 17 October 2025 |
2.39 (-2.45%) |
2.50 |
2.32 - 2.50 |
0.9051 times |
Fri 10 October 2025 |
2.45 (-2%) |
2.50 |
2.27 - 2.54 |
0.9909 times |
Fri 03 October 2025 |
2.50 (0.4%) |
2.53 |
2.42 - 2.57 |
0.507 times |
Fri 26 September 2025 |
2.49 (-1.58%) |
2.50 |
2.45 - 2.54 |
0.9266 times |
Fri 19 September 2025 |
2.53 (-0.39%) |
2.50 |
2.50 - 2.66 |
1.3165 times |
Fri 12 September 2025 |
2.54 (-1.17%) |
2.59 |
2.47 - 2.75 |
1.3672 times |
Fri 05 September 2025 |
2.57 (-1.15%) |
2.55 |
2.50 - 2.68 |
0.9001 times |
Fri 29 August 2025 |
2.60 (-4.06%) |
2.66 |
2.52 - 2.85 |
0.6741 times |
Fri 22 August 2025 |
2.71 (5.45%) |
2.57 |
2.31 - 2.95 |
1.9106 times |
Thu 14 August 2025 |
2.57 (0.39%) |
2.60 |
2.50 - 2.68 |
0.5215 times |

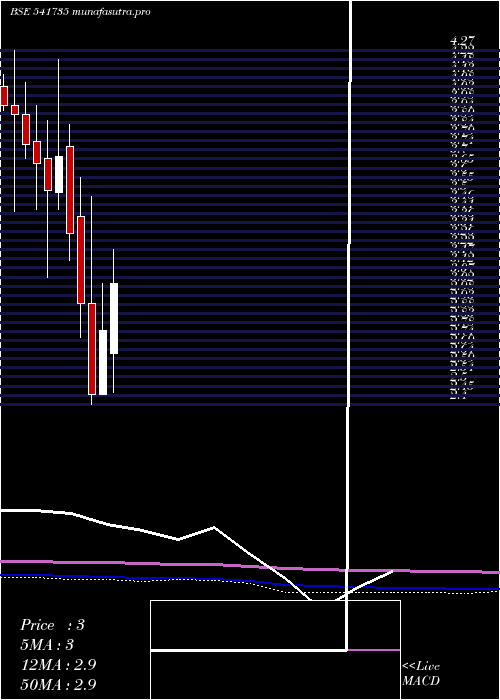
Monthly price and charts Vivanta Strong monthly Stock price targets for Vivanta 541735 are 2.21 and 2.48 | Monthly Target 1 | 2.14 | | Monthly Target 2 | 2.27 | | Monthly Target 3 | 2.4066666666667 | | Monthly Target 4 | 2.54 | | Monthly Target 5 | 2.68 |
Monthly price and volumes Vivanta
| Date |
Closing |
Open |
Range |
Volume |
Tue 21 October 2025 |
2.41 (-3.98%) |
2.51 |
2.27 - 2.54 |
0.5448 times |
Tue 30 September 2025 |
2.51 (-3.46%) |
2.55 |
2.45 - 2.75 |
0.9869 times |
Fri 29 August 2025 |
2.60 (-7.8%) |
2.85 |
2.31 - 2.95 |
0.8951 times |
Thu 31 July 2025 |
2.82 (-4.08%) |
2.95 |
2.60 - 2.99 |
0.9719 times |
Mon 30 June 2025 |
2.94 (-2%) |
3.03 |
2.60 - 3.25 |
0.9733 times |
Fri 30 May 2025 |
3.00 (7.53%) |
2.67 |
2.46 - 3.22 |
1.3488 times |
Wed 30 April 2025 |
2.79 (13.88%) |
2.45 |
2.45 - 3.04 |
0.64 times |
Fri 28 March 2025 |
2.45 (-16.38%) |
2.93 |
2.40 - 3.50 |
1.2844 times |
Fri 28 February 2025 |
2.93 (-11.21%) |
3.39 |
2.75 - 3.60 |
0.9458 times |
Fri 31 January 2025 |
3.30 (-11.05%) |
3.76 |
3.16 - 3.88 |
1.4089 times |
Tue 31 December 2024 |
3.71 (5.1%) |
3.52 |
3.43 - 4.22 |
2.372 times |
DMA SMA EMA moving averages of Vivanta 541735
DMA (daily moving average) of Vivanta 541735
| DMA period | DMA value | | 5 day DMA | 2.4 | | 12 day DMA | 2.42 | | 20 day DMA | 2.45 | | 35 day DMA | 2.49 | | 50 day DMA | 2.54 | | 100 day DMA | 2.72 | | 150 day DMA | 2.76 | | 200 day DMA | 2.91 | EMA (exponential moving average) of Vivanta 541735
| EMA period | EMA current | EMA prev | EMA prev2 | | 5 day EMA | 2.4 | 2.4 | 2.4 | | 12 day EMA | 2.43 | 2.43 | 2.43 | | 20 day EMA | 2.45 | 2.45 | 2.45 | | 35 day EMA | 2.48 | 2.48 | 2.48 | | 50 day EMA | 2.53 | 2.53 | 2.54 |
SMA (simple moving average) of Vivanta 541735
| SMA period | SMA current | SMA prev | SMA prev2 | | 5 day SMA | 2.4 | 2.39 | 2.4 | | 12 day SMA | 2.42 | 2.43 | 2.43 | | 20 day SMA | 2.45 | 2.46 | 2.47 | | 35 day SMA | 2.49 | 2.5 | 2.51 | | 50 day SMA | 2.54 | 2.54 | 2.55 | | 100 day SMA | 2.72 | 2.73 | 2.73 | | 150 day SMA | 2.76 | 2.77 | 2.77 | | 200 day SMA | 2.91 | 2.91 | 2.92 |
|
|
