Gfil 541703 full analysis,charts,indicators,moving averages,SMA,DMA,EMA,ADX,MACD,RSIGfil 541703 WideScreen charts, DMA,SMA,EMA technical analysis, forecast prediction, by indicators ADX,MACD,RSI,CCI BSE stock exchange
Daily price and charts and targets Gfil Strong Daily Stock price targets for Gfil 541703 are 13 and 15 | Daily Target 1 | 11.33 | | Daily Target 2 | 12.67 | | Daily Target 3 | 13.333333333333 | | Daily Target 4 | 14.67 | | Daily Target 5 | 15.33 |
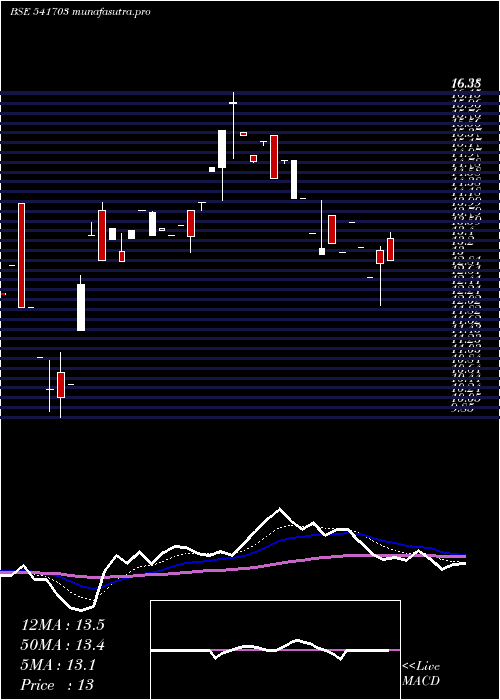
Daily price and volume Gfil
| Date |
Closing |
Open |
Range |
Volume |
Fri 05 December 2025 |
14.00 (6.87%) |
12.00 |
12.00 - 14.00 |
1.2903 times |
Thu 04 December 2025 |
13.10 (-9.66%) |
13.10 |
13.10 - 13.10 |
0.3226 times |
Thu 27 November 2025 |
14.50 (4.32%) |
14.50 |
14.50 - 14.50 |
0.3226 times |
Wed 26 November 2025 |
13.90 (9.02%) |
13.55 |
13.55 - 13.90 |
0.6452 times |
Mon 24 November 2025 |
12.75 (-8.93%) |
13.58 |
12.75 - 13.95 |
0.9677 times |
Tue 18 November 2025 |
14.00 (-5.08%) |
13.50 |
13.50 - 15.50 |
1.6129 times |
Fri 14 November 2025 |
14.75 (6.5%) |
14.75 |
14.75 - 14.75 |
0.3226 times |
Thu 13 November 2025 |
13.85 (-1.07%) |
13.05 |
13.01 - 13.85 |
0.9677 times |
Wed 12 November 2025 |
14.00 (-6.67%) |
15.75 |
14.00 - 15.75 |
1.2903 times |
Tue 11 November 2025 |
15.00 (-0.53%) |
15.00 |
14.99 - 15.00 |
2.2581 times |
Mon 10 November 2025 |
15.08 (7.71%) |
14.75 |
14.75 - 15.10 |
1.2903 times |
Weekly price and charts Gfil Strong weekly Stock price targets for Gfil 541703 are 13 and 15 | Weekly Target 1 | 11.33 | | Weekly Target 2 | 12.67 | | Weekly Target 3 | 13.333333333333 | | Weekly Target 4 | 14.67 | | Weekly Target 5 | 15.33 |
Weekly price and volumes for Gfil
| Date |
Closing |
Open |
Range |
Volume |
Fri 05 December 2025 |
14.00 (-3.45%) |
13.10 |
12.00 - 14.00 |
0.463 times |
Thu 27 November 2025 |
14.50 (3.57%) |
13.58 |
12.75 - 14.50 |
0.5556 times |
Tue 18 November 2025 |
14.00 (-5.08%) |
13.50 |
13.50 - 15.50 |
0.463 times |
Fri 14 November 2025 |
14.75 (5.36%) |
14.75 |
13.01 - 15.75 |
1.7593 times |
Fri 07 November 2025 |
14.00 (7.69%) |
14.15 |
11.61 - 15.00 |
2.4074 times |
Fri 17 October 2025 |
13.00 (4.84%) |
11.50 |
11.50 - 13.00 |
0.6481 times |
Wed 01 October 2025 |
12.40 (-6.7%) |
13.01 |
12.37 - 13.01 |
0.3704 times |
Wed 24 September 2025 |
13.29 (-1.56%) |
12.85 |
12.35 - 13.29 |
0.6481 times |
Wed 17 September 2025 |
13.50 (1.89%) |
13.25 |
13.25 - 13.70 |
0.3704 times |
Fri 12 September 2025 |
13.25 (-1.49%) |
12.78 |
12.78 - 14.05 |
2.3148 times |
Fri 05 September 2025 |
13.45 (1.43%) |
12.65 |
12.10 - 13.57 |
3.7037 times |

Monthly price and charts Gfil Strong monthly Stock price targets for Gfil 541703 are 13 and 15 | Monthly Target 1 | 11.33 | | Monthly Target 2 | 12.67 | | Monthly Target 3 | 13.333333333333 | | Monthly Target 4 | 14.67 | | Monthly Target 5 | 15.33 |
Monthly price and volumes Gfil
| Date |
Closing |
Open |
Range |
Volume |
Fri 05 December 2025 |
14.00 (-3.45%) |
13.10 |
12.00 - 14.00 |
0.0619 times |
Thu 27 November 2025 |
14.50 (13.28%) |
11.61 |
11.61 - 15.75 |
0.5322 times |
Thu 30 October 2025 |
12.80 (-1.61%) |
12.45 |
11.50 - 15.00 |
0.2847 times |
Tue 30 September 2025 |
13.01 (-1.89%) |
12.65 |
12.10 - 14.05 |
0.953 times |
Thu 21 August 2025 |
13.26 (-11.6%) |
14.25 |
13.12 - 15.00 |
0.4084 times |
Mon 28 July 2025 |
15.00 (15.65%) |
13.45 |
13.15 - 16.38 |
2.3886 times |
Mon 30 June 2025 |
12.97 (10.38%) |
12.33 |
9.85 - 14.17 |
1.3861 times |
Fri 30 May 2025 |
11.75 (1.56%) |
12.00 |
10.50 - 15.30 |
2.302 times |
Fri 25 April 2025 |
11.57 (1.85%) |
11.16 |
11.15 - 11.82 |
0.1856 times |
Fri 28 March 2025 |
11.36 (3.74%) |
10.45 |
9.34 - 11.96 |
1.4975 times |
Fri 28 February 2025 |
10.95 (-20.77%) |
13.55 |
10.95 - 14.00 |
0.6436 times |

DMA SMA EMA moving averages of Gfil 541703
DMA (daily moving average) of Gfil 541703
| DMA period | DMA value | | 5 day DMA | 13.65 | | 12 day DMA | 14.08 | | 20 day DMA | 13.61 | | 35 day DMA | 13.43 | | 50 day DMA | 13.77 | | 100 day DMA | 13.07 | | 150 day DMA | 12.74 | | 200 day DMA | 14.8 | EMA (exponential moving average) of Gfil 541703
| EMA period | EMA current | EMA prev | EMA prev2 | | 5 day EMA | 13.81 | 13.71 | 14.02 | | 12 day EMA | 13.81 | 13.78 | 13.9 | | 20 day EMA | 13.75 | 13.72 | 13.78 | | 35 day EMA | 13.78 | 13.77 | 13.81 | | 50 day EMA | 13.75 | 13.74 | 13.77 |
SMA (simple moving average) of Gfil 541703
| SMA period | SMA current | SMA prev | SMA prev2 | | 5 day SMA | 13.65 | 13.65 | 13.98 | | 12 day SMA | 14.08 | 13.98 | 14.01 | | 20 day SMA | 13.61 | 13.53 | 13.52 | | 35 day SMA | 13.43 | 13.42 | 13.42 | | 50 day SMA | 13.77 | 13.77 | 13.78 | | 100 day SMA | 13.07 | 13.04 | 13.02 | | 150 day SMA | 12.74 | 12.75 | 12.78 | | 200 day SMA | 14.8 | 14.83 | 14.87 |
|
|
