Active 541144 full analysis,charts,indicators,moving averages,SMA,DMA,EMA,ADX,MACD,RSIActive 541144 WideScreen charts, DMA,SMA,EMA technical analysis, forecast prediction, by indicators ADX,MACD,RSI,CCI BSE stock exchange
Daily price and charts and targets Active Strong Daily Stock price targets for Active 541144 are 104.88 and 112.38 | Daily Target 1 | 103.18 | | Daily Target 2 | 106.57 | | Daily Target 3 | 110.68333333333 | | Daily Target 4 | 114.07 | | Daily Target 5 | 118.18 |
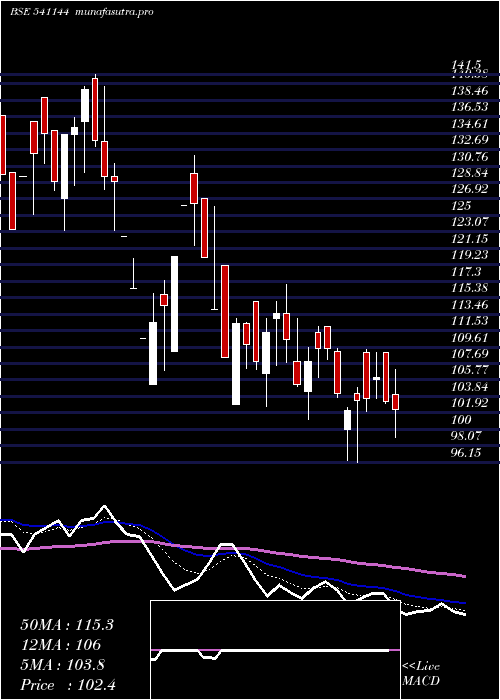
Daily price and volume Active
| Date |
Closing |
Open |
Range |
Volume |
Thu 23 October 2025 |
109.95 (-0.5%) |
111.50 |
107.30 - 114.80 |
0.8924 times |
Tue 21 October 2025 |
110.50 (1.1%) |
110.00 |
109.30 - 112.00 |
0.1634 times |
Mon 20 October 2025 |
109.30 (1.3%) |
106.50 |
106.50 - 110.45 |
0.3656 times |
Fri 17 October 2025 |
107.90 (-0.55%) |
108.05 |
106.15 - 108.50 |
0.2785 times |
Thu 16 October 2025 |
108.50 (-0.37%) |
110.00 |
105.75 - 110.00 |
0.9117 times |
Wed 15 October 2025 |
108.90 (-5.3%) |
117.05 |
106.20 - 119.00 |
2.8755 times |
Tue 14 October 2025 |
115.00 (1.95%) |
113.90 |
109.00 - 116.75 |
0.6033 times |
Mon 13 October 2025 |
112.80 (-1.87%) |
115.00 |
112.20 - 115.90 |
0.9377 times |
Fri 10 October 2025 |
114.95 (2.45%) |
113.90 |
110.00 - 117.80 |
2.1576 times |
Thu 09 October 2025 |
112.20 (-1.54%) |
113.00 |
111.00 - 114.40 |
0.8144 times |
Wed 08 October 2025 |
113.95 (-0.83%) |
115.00 |
113.00 - 116.00 |
1.1548 times |
Weekly price and charts Active Strong weekly Stock price targets for Active 541144 are 108.23 and 116.53 | Weekly Target 1 | 102.12 | | Weekly Target 2 | 106.03 | | Weekly Target 3 | 110.41666666667 | | Weekly Target 4 | 114.33 | | Weekly Target 5 | 118.72 |
Weekly price and volumes for Active
| Date |
Closing |
Open |
Range |
Volume |
Thu 23 October 2025 |
109.95 (1.9%) |
106.50 |
106.50 - 114.80 |
0.3851 times |
Fri 17 October 2025 |
107.90 (-6.13%) |
115.00 |
105.75 - 119.00 |
1.5189 times |
Fri 10 October 2025 |
114.95 (0.48%) |
115.90 |
110.00 - 117.90 |
1.5811 times |
Fri 03 October 2025 |
114.40 (-10.56%) |
128.95 |
112.85 - 133.00 |
1.8609 times |
Fri 26 September 2025 |
127.90 (2.32%) |
131.25 |
124.05 - 134.00 |
1.4913 times |
Fri 19 September 2025 |
125.00 (0.81%) |
124.00 |
120.00 - 131.50 |
0.3682 times |
Fri 12 September 2025 |
124.00 (-11.74%) |
144.50 |
121.05 - 144.50 |
1.2399 times |
Fri 05 September 2025 |
140.50 (4.31%) |
140.20 |
132.80 - 144.95 |
0.2853 times |
Fri 29 August 2025 |
134.70 (-6.88%) |
145.60 |
130.15 - 145.60 |
0.2781 times |
Fri 22 August 2025 |
144.65 (-2.79%) |
149.40 |
142.55 - 155.00 |
0.9912 times |
Thu 14 August 2025 |
148.80 (14.81%) |
129.60 |
129.50 - 148.80 |
1.7287 times |

Monthly price and charts Active Strong monthly Stock price targets for Active 541144 are 99.83 and 115.88 | Monthly Target 1 | 96.45 | | Monthly Target 2 | 103.2 | | Monthly Target 3 | 112.5 | | Monthly Target 4 | 119.25 | | Monthly Target 5 | 128.55 |
Monthly price and volumes Active
| Date |
Closing |
Open |
Range |
Volume |
Thu 23 October 2025 |
109.95 (-10.61%) |
118.10 |
105.75 - 121.80 |
0.3397 times |
Tue 30 September 2025 |
123.00 (-8.69%) |
140.20 |
119.90 - 144.95 |
0.3346 times |
Fri 29 August 2025 |
134.70 (-9.87%) |
149.50 |
128.15 - 155.00 |
0.3214 times |
Thu 31 July 2025 |
149.45 (15.49%) |
133.00 |
130.00 - 161.00 |
1.2597 times |
Mon 30 June 2025 |
129.40 (24.82%) |
103.05 |
98.45 - 150.75 |
1.5844 times |
Fri 30 May 2025 |
103.67 (6.49%) |
97.85 |
82.55 - 106.00 |
0.7328 times |
Wed 30 April 2025 |
97.35 (-9.78%) |
111.30 |
96.15 - 112.00 |
0.4846 times |
Fri 28 March 2025 |
107.90 (-11.95%) |
116.45 |
101.10 - 132.00 |
0.7536 times |
Fri 28 February 2025 |
122.55 (-5.33%) |
129.15 |
122.55 - 146.75 |
0.9358 times |
Fri 31 January 2025 |
129.45 (19.31%) |
107.40 |
101.10 - 161.20 |
3.2535 times |
Tue 31 December 2024 |
108.50 (3.04%) |
108.95 |
99.95 - 129.40 |
1.6198 times |

DMA SMA EMA moving averages of Active 541144
DMA (daily moving average) of Active 541144
| DMA period | DMA value | | 5 day DMA | 109.23 | | 12 day DMA | 111.57 | | 20 day DMA | 115.91 | | 35 day DMA | 122.21 | | 50 day DMA | 128.26 | | 100 day DMA | 133.15 | | 150 day DMA | 123.72 | | 200 day DMA | 124.22 | EMA (exponential moving average) of Active 541144
| EMA period | EMA current | EMA prev | EMA prev2 | | 5 day EMA | 110.02 | 110.06 | 109.84 | | 12 day EMA | 112.23 | 112.64 | 113.03 | | 20 day EMA | 115.49 | 116.07 | 116.66 | | 35 day EMA | 121.33 | 122 | 122.68 | | 50 day EMA | 127.32 | 128.03 | 128.75 |
SMA (simple moving average) of Active 541144
| SMA period | SMA current | SMA prev | SMA prev2 | | 5 day SMA | 109.23 | 109.02 | 109.92 | | 12 day SMA | 111.57 | 111.9 | 112.23 | | 20 day SMA | 115.91 | 116.96 | 117.93 | | 35 day SMA | 122.21 | 123.03 | 123.75 | | 50 day SMA | 128.26 | 128.65 | 129.14 | | 100 day SMA | 133.15 | 133.08 | 133.01 | | 150 day SMA | 123.72 | 123.75 | 123.76 | | 200 day SMA | 124.22 | 124.21 | 124.22 |
|
|
