Kancotea 541005 full analysis,charts,indicators,moving averages,SMA,DMA,EMA,ADX,MACD,RSIKancotea 541005 WideScreen charts, DMA,SMA,EMA technical analysis, forecast prediction, by indicators ADX,MACD,RSI,CCI BSE stock exchange
Daily price and charts and targets Kancotea Strong Daily Stock price targets for Kancotea 541005 are 62.2 and 63 | Daily Target 1 | 61.6 | | Daily Target 2 | 62 | | Daily Target 3 | 62.4 | | Daily Target 4 | 62.8 | | Daily Target 5 | 63.2 |
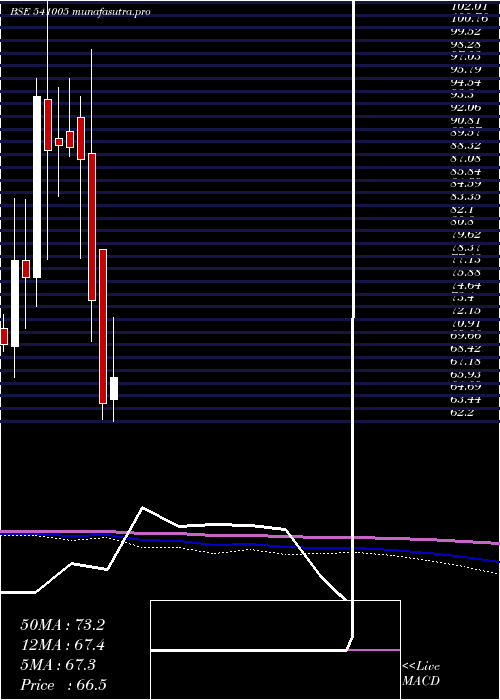
Daily price and volume Kancotea
| Date |
Closing |
Open |
Range |
Volume |
Thu 23 October 2025 |
62.40 (0.65%) |
62.00 |
62.00 - 62.80 |
0.1457 times |
Tue 21 October 2025 |
62.00 (-1.51%) |
62.10 |
62.00 - 62.10 |
0.2354 times |
Mon 20 October 2025 |
62.95 (1.37%) |
63.00 |
62.04 - 63.00 |
1.2845 times |
Fri 17 October 2025 |
62.10 (-1.19%) |
62.85 |
62.06 - 63.16 |
0.2085 times |
Thu 16 October 2025 |
62.85 (1.26%) |
62.10 |
62.05 - 62.85 |
0.1592 times |
Wed 15 October 2025 |
62.07 (0.11%) |
62.40 |
62.06 - 62.95 |
2.2013 times |
Tue 14 October 2025 |
62.00 (-2.52%) |
62.85 |
62.00 - 63.55 |
3.961 times |
Mon 13 October 2025 |
63.60 (0.87%) |
63.05 |
62.71 - 63.80 |
0.7196 times |
Fri 10 October 2025 |
63.05 (-1.33%) |
62.36 |
62.36 - 63.90 |
0.5245 times |
Thu 09 October 2025 |
63.90 (1.11%) |
63.90 |
63.00 - 63.95 |
0.5604 times |
Wed 08 October 2025 |
63.20 (-2.77%) |
65.00 |
62.01 - 65.00 |
1.957 times |

Weekly price and charts Kancotea Strong weekly Stock price targets for Kancotea 541005 are 61.7 and 62.7 | Weekly Target 1 | 61.47 | | Weekly Target 2 | 61.93 | | Weekly Target 3 | 62.466666666667 | | Weekly Target 4 | 62.93 | | Weekly Target 5 | 63.47 |
Weekly price and volumes for Kancotea
| Date |
Closing |
Open |
Range |
Volume |
Thu 23 October 2025 |
62.40 (0.48%) |
63.00 |
62.00 - 63.00 |
0.2781 times |
Fri 17 October 2025 |
62.10 (-1.51%) |
63.05 |
62.00 - 63.80 |
1.2103 times |
Fri 10 October 2025 |
63.05 (-3.1%) |
65.20 |
62.01 - 66.00 |
0.6224 times |
Fri 03 October 2025 |
65.07 (2.55%) |
64.50 |
62.35 - 66.45 |
0.2747 times |
Fri 26 September 2025 |
63.45 (-7.36%) |
68.00 |
63.41 - 68.90 |
1.6455 times |
Fri 19 September 2025 |
68.49 (2.25%) |
67.80 |
66.52 - 68.49 |
0.8896 times |
Fri 12 September 2025 |
66.98 (-1.41%) |
66.50 |
66.35 - 68.47 |
0.1504 times |
Fri 05 September 2025 |
67.94 (-0.09%) |
67.90 |
65.53 - 68.95 |
0.4584 times |
Fri 29 August 2025 |
68.00 (0%) |
65.56 |
64.30 - 69.50 |
0.3495 times |
Fri 22 August 2025 |
68.00 (3.63%) |
66.40 |
64.10 - 70.00 |
4.1211 times |
Thu 14 August 2025 |
65.62 (0%) |
63.02 |
62.04 - 66.40 |
1.6975 times |

Monthly price and charts Kancotea Strong monthly Stock price targets for Kancotea 541005 are 59.98 and 64.43 | Monthly Target 1 | 59.17 | | Monthly Target 2 | 60.78 | | Monthly Target 3 | 63.616666666667 | | Monthly Target 4 | 65.23 | | Monthly Target 5 | 68.07 |
Monthly price and volumes Kancotea
| Date |
Closing |
Open |
Range |
Volume |
Thu 23 October 2025 |
62.40 (-2.92%) |
64.15 |
62.00 - 66.45 |
0.2144 times |
Tue 30 September 2025 |
64.28 (-5.47%) |
67.90 |
63.41 - 68.95 |
0.3176 times |
Fri 29 August 2025 |
68.00 (6.13%) |
69.50 |
62.00 - 71.69 |
1.7171 times |
Thu 31 July 2025 |
64.07 (-11.44%) |
73.99 |
62.30 - 74.00 |
0.9683 times |
Mon 30 June 2025 |
72.35 (-2.04%) |
72.02 |
67.00 - 79.00 |
1.0978 times |
Fri 30 May 2025 |
73.86 (7.26%) |
69.50 |
62.80 - 80.00 |
0.7616 times |
Wed 30 April 2025 |
68.86 (7.76%) |
64.30 |
62.20 - 72.89 |
0.4336 times |
Fri 28 March 2025 |
63.90 (-13.66%) |
79.00 |
62.32 - 79.00 |
1.7773 times |
Fri 28 February 2025 |
74.01 (-15.73%) |
88.40 |
70.00 - 98.60 |
0.608 times |
Fri 31 January 2025 |
87.83 (-1.31%) |
92.00 |
78.10 - 94.00 |
2.1044 times |
Tue 31 December 2024 |
89.00 (-0.2%) |
90.55 |
88.10 - 95.80 |
2.336 times |
DMA SMA EMA moving averages of Kancotea 541005
DMA (daily moving average) of Kancotea 541005
| DMA period | DMA value | | 5 day DMA | 62.46 | | 12 day DMA | 62.93 | | 20 day DMA | 63.76 | | 35 day DMA | 65.39 | | 50 day DMA | 65.79 | | 100 day DMA | 67.75 | | 150 day DMA | 68.12 | | 200 day DMA | 72.14 | EMA (exponential moving average) of Kancotea 541005
| EMA period | EMA current | EMA prev | EMA prev2 | | 5 day EMA | 62.45 | 62.47 | 62.71 | | 12 day EMA | 63.04 | 63.16 | 63.37 | | 20 day EMA | 63.74 | 63.88 | 64.08 | | 35 day EMA | 64.5 | 64.62 | 64.77 | | 50 day EMA | 65.35 | 65.47 | 65.61 |
SMA (simple moving average) of Kancotea 541005
| SMA period | SMA current | SMA prev | SMA prev2 | | 5 day SMA | 62.46 | 62.39 | 62.39 | | 12 day SMA | 62.93 | 63.23 | 63.48 | | 20 day SMA | 63.76 | 64.06 | 64.3 | | 35 day SMA | 65.39 | 65.57 | 65.69 | | 50 day SMA | 65.79 | 65.85 | 65.86 | | 100 day SMA | 67.75 | 67.87 | 67.97 | | 150 day SMA | 68.12 | 68.18 | 68.23 | | 200 day SMA | 72.14 | 72.28 | 72.42 |
|
|
