Galaxysurf 540935 full analysis,charts,indicators,moving averages,SMA,DMA,EMA,ADX,MACD,RSIGalaxysurf 540935 WideScreen charts, DMA,SMA,EMA technical analysis, forecast prediction, by indicators ADX,MACD,RSI,CCI BSE stock exchange
Daily price and charts and targets Galaxysurf Strong Daily Stock price targets for Galaxysurf 540935 are 2285.55 and 2320.15 | Daily Target 1 | 2278.7 | | Daily Target 2 | 2292.4 | | Daily Target 3 | 2313.3 | | Daily Target 4 | 2327 | | Daily Target 5 | 2347.9 |
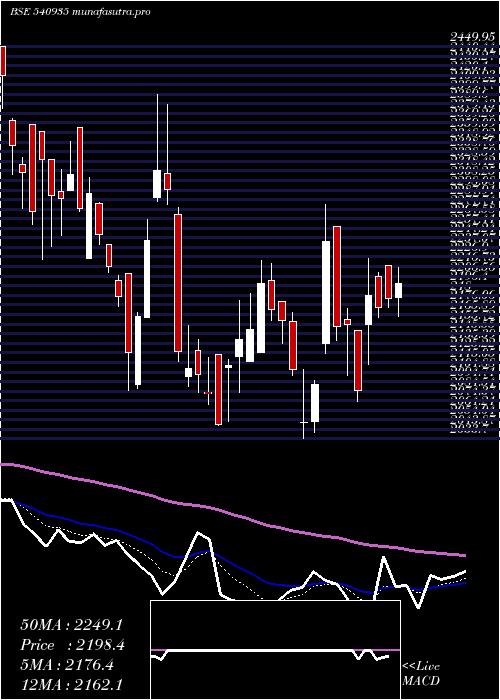
Daily price and volume Galaxysurf
| Date |
Closing |
Open |
Range |
Volume |
Wed 03 September 2025 |
2306.10 (-0.61%) |
2334.20 |
2299.60 - 2334.20 |
0.3678 times |
Tue 02 September 2025 |
2320.30 (1.53%) |
2248.05 |
2248.05 - 2329.55 |
0.7386 times |
Mon 01 September 2025 |
2285.35 (1.06%) |
2319.95 |
2261.80 - 2319.95 |
0.5134 times |
Fri 29 August 2025 |
2261.30 (0.93%) |
2241.80 |
2237.20 - 2315.35 |
0.7529 times |
Thu 28 August 2025 |
2240.45 (0.29%) |
2349.95 |
2220.00 - 2349.95 |
0.4931 times |
Tue 26 August 2025 |
2234.00 (-1.33%) |
2218.95 |
2216.00 - 2244.40 |
1.2531 times |
Mon 25 August 2025 |
2264.15 (2.14%) |
2289.95 |
2220.05 - 2289.95 |
0.6489 times |
Fri 22 August 2025 |
2216.75 (-0.42%) |
2248.95 |
2191.65 - 2248.95 |
1.1991 times |
Thu 21 August 2025 |
2226.15 (1.9%) |
2219.95 |
2188.00 - 2238.35 |
1.2439 times |
Wed 20 August 2025 |
2184.70 (-2.16%) |
2347.95 |
2178.10 - 2347.95 |
2.7893 times |
Tue 19 August 2025 |
2232.95 (-0.25%) |
2263.00 |
2224.50 - 2280.90 |
1.8215 times |
Weekly price and charts Galaxysurf Strong weekly Stock price targets for Galaxysurf 540935 are 2234 and 2320.15 | Weekly Target 1 | 2209.97 | | Weekly Target 2 | 2258.03 | | Weekly Target 3 | 2296.1166666667 | | Weekly Target 4 | 2344.18 | | Weekly Target 5 | 2382.27 |
Weekly price and volumes for Galaxysurf
| Date |
Closing |
Open |
Range |
Volume |
Wed 03 September 2025 |
2306.10 (1.98%) |
2319.95 |
2248.05 - 2334.20 |
0.2685 times |
Fri 29 August 2025 |
2261.30 (2.01%) |
2289.95 |
2216.00 - 2349.95 |
0.5219 times |
Fri 22 August 2025 |
2216.75 (-2.18%) |
2284.50 |
2178.10 - 2347.95 |
1.2841 times |
Thu 14 August 2025 |
2266.25 (-7.14%) |
2432.65 |
2257.90 - 2449.80 |
0.4856 times |
Fri 08 August 2025 |
2440.40 (-7.97%) |
2620.25 |
2410.05 - 2629.85 |
0.6244 times |
Fri 01 August 2025 |
2651.65 (2.2%) |
2589.25 |
2180.05 - 2750.00 |
2.7359 times |
Fri 25 July 2025 |
2594.65 (1.87%) |
2547.10 |
2544.40 - 2660.00 |
1.2856 times |
Fri 18 July 2025 |
2547.10 (0.05%) |
2538.55 |
2070.05 - 2649.95 |
0.988 times |
Fri 11 July 2025 |
2545.85 (-1.65%) |
2586.70 |
2456.75 - 2639.75 |
0.7703 times |
Fri 04 July 2025 |
2588.55 (-0.03%) |
2577.60 |
2556.05 - 2637.55 |
1.0355 times |
Fri 27 June 2025 |
2589.25 (3.75%) |
2501.00 |
2486.85 - 2696.95 |
1.4838 times |

Monthly price and charts Galaxysurf Strong monthly Stock price targets for Galaxysurf 540935 are 2234 and 2320.15 | Monthly Target 1 | 2209.97 | | Monthly Target 2 | 2258.03 | | Monthly Target 3 | 2296.1166666667 | | Monthly Target 4 | 2344.18 | | Monthly Target 5 | 2382.27 |
Monthly price and volumes Galaxysurf
| Date |
Closing |
Open |
Range |
Volume |
Wed 03 September 2025 |
2306.10 (1.98%) |
2319.95 |
2248.05 - 2334.20 |
0.0275 times |
Fri 29 August 2025 |
2261.30 (-14.89%) |
2670.30 |
2178.10 - 2694.25 |
0.3169 times |
Thu 31 July 2025 |
2656.80 (1.67%) |
2613.25 |
2070.05 - 2750.00 |
0.6518 times |
Mon 30 June 2025 |
2613.25 (13.2%) |
2343.95 |
2292.55 - 2696.95 |
0.5312 times |
Fri 30 May 2025 |
2308.50 (11.41%) |
2071.55 |
2025.00 - 2383.95 |
0.442 times |
Wed 30 April 2025 |
2072.05 (1.01%) |
2052.60 |
2041.00 - 2282.65 |
6.5909 times |
Fri 28 March 2025 |
2051.25 (-6.12%) |
2209.30 |
2033.70 - 2399.00 |
0.4369 times |
Fri 28 February 2025 |
2184.90 (-8.62%) |
2406.95 |
2174.15 - 2473.90 |
0.1727 times |
Fri 31 January 2025 |
2391.10 (-5.13%) |
2510.30 |
2244.05 - 2699.95 |
0.3667 times |
Tue 31 December 2024 |
2520.40 (-10.46%) |
2805.00 |
2485.70 - 2933.05 |
0.4634 times |
Fri 29 November 2024 |
2814.85 (-4%) |
2932.15 |
2612.10 - 3113.00 |
0.2917 times |
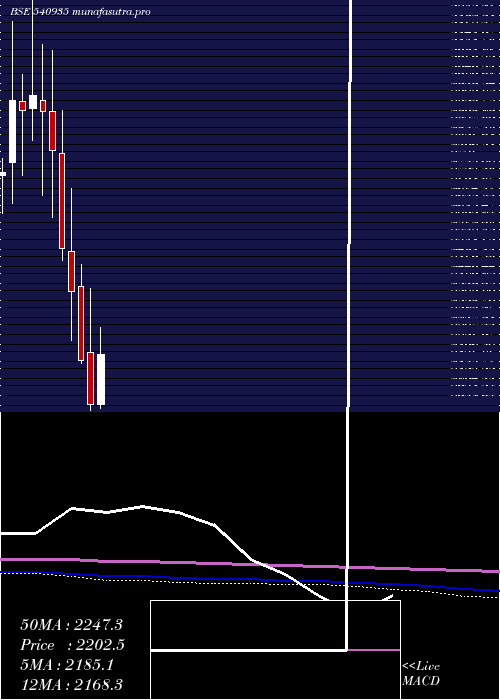
DMA SMA EMA moving averages of Galaxysurf 540935
DMA (daily moving average) of Galaxysurf 540935
| DMA period | DMA value | | 5 day DMA | 2282.7 | | 12 day DMA | 2250.89 | | 20 day DMA | 2316.55 | | 35 day DMA | 2439.51 | | 50 day DMA | 2481.2 | | 100 day DMA | 2368.25 | | 150 day DMA | 2335.96 | | 200 day DMA | 2430.47 | EMA (exponential moving average) of Galaxysurf 540935
| EMA period | EMA current | EMA prev | EMA prev2 | | 5 day EMA | 2288.92 | 2280.33 | 2260.35 | | 12 day EMA | 2292.28 | 2289.77 | 2284.22 | | 20 day EMA | 2329.83 | 2332.33 | 2333.6 | | 35 day EMA | 2387.02 | 2391.78 | 2395.99 | | 50 day EMA | 2464.38 | 2470.84 | 2476.98 |
SMA (simple moving average) of Galaxysurf 540935
| SMA period | SMA current | SMA prev | SMA prev2 | | 5 day SMA | 2282.7 | 2268.28 | 2257.05 | | 12 day SMA | 2250.89 | 2247.57 | 2249.26 | | 20 day SMA | 2316.55 | 2329.45 | 2346.01 | | 35 day SMA | 2439.51 | 2446.59 | 2453.04 | | 50 day SMA | 2481.2 | 2486.23 | 2489.73 | | 100 day SMA | 2368.25 | 2367.63 | 2365.34 | | 150 day SMA | 2335.96 | 2337.19 | 2338.02 | | 200 day SMA | 2430.47 | 2434.2 | 2437.25 |
|
|
