Newgen 540900 full analysis,charts,indicators,moving averages,SMA,DMA,EMA,ADX,MACD,RSINewgen 540900 WideScreen charts, DMA,SMA,EMA technical analysis, forecast prediction, by indicators ADX,MACD,RSI,CCI BSE stock exchange
Daily price and charts and targets Newgen Strong Daily Stock price targets for Newgen 540900 are 871.68 and 885.48 | Daily Target 1 | 868.53 | | Daily Target 2 | 874.82 | | Daily Target 3 | 882.33333333333 | | Daily Target 4 | 888.62 | | Daily Target 5 | 896.13 |
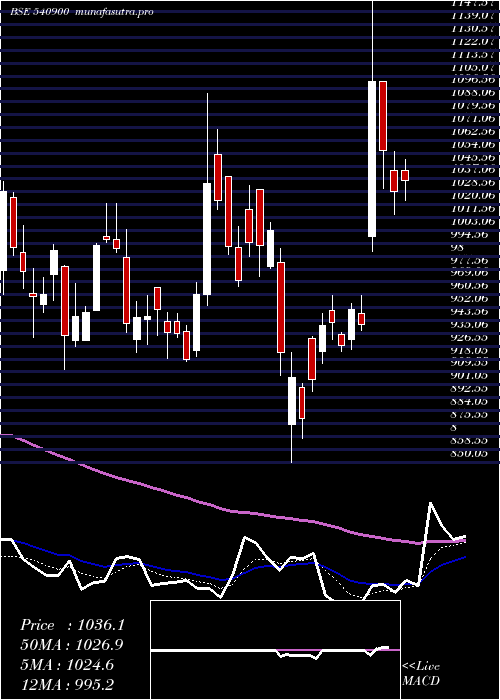
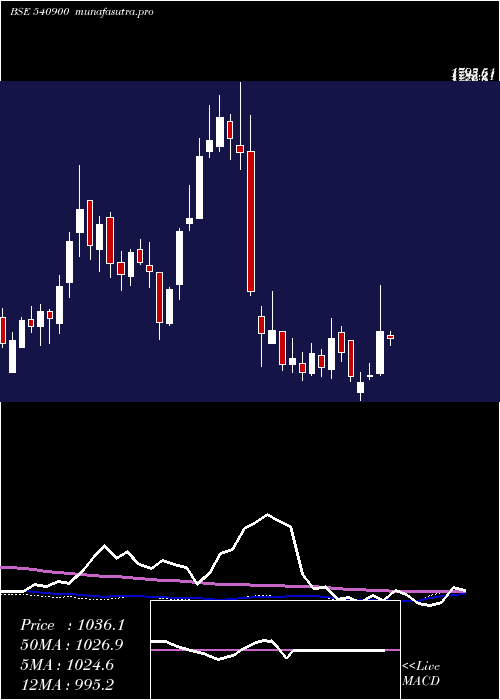
Daily price and volume Newgen
| Date |
Closing |
Open |
Range |
Volume |
Tue 21 October 2025 |
881.10 (0.13%) |
881.25 |
876.05 - 889.85 |
0.1596 times |
Mon 20 October 2025 |
879.95 (1.11%) |
872.00 |
872.00 - 889.45 |
0.4537 times |
Fri 17 October 2025 |
870.30 (-0.79%) |
879.95 |
868.85 - 884.00 |
0.3721 times |
Thu 16 October 2025 |
877.20 (-0.9%) |
883.85 |
872.95 - 883.85 |
0.3968 times |
Wed 15 October 2025 |
885.20 (4.19%) |
835.05 |
835.05 - 909.40 |
5.9781 times |
Tue 14 October 2025 |
849.60 (-1.78%) |
865.10 |
848.00 - 868.40 |
0.3663 times |
Mon 13 October 2025 |
865.00 (-0.82%) |
870.95 |
861.40 - 870.95 |
0.8336 times |
Fri 10 October 2025 |
872.15 (0.05%) |
877.95 |
870.65 - 881.35 |
0.4914 times |
Thu 09 October 2025 |
871.75 (-0.05%) |
874.90 |
865.20 - 881.75 |
0.4396 times |
Wed 08 October 2025 |
872.20 (-1.2%) |
882.75 |
867.55 - 897.00 |
0.5088 times |
Tue 07 October 2025 |
882.75 (0.04%) |
889.95 |
878.00 - 891.85 |
0.2773 times |
Weekly price and charts Newgen Strong weekly Stock price targets for Newgen 540900 are 876.55 and 894.4 | Weekly Target 1 | 863.13 | | Weekly Target 2 | 872.12 | | Weekly Target 3 | 880.98333333333 | | Weekly Target 4 | 889.97 | | Weekly Target 5 | 898.83 |
Weekly price and volumes for Newgen
| Date |
Closing |
Open |
Range |
Volume |
Tue 21 October 2025 |
881.10 (1.24%) |
872.00 |
872.00 - 889.85 |
0.0664 times |
Fri 17 October 2025 |
870.30 (-0.21%) |
870.95 |
835.05 - 909.40 |
0.8603 times |
Fri 10 October 2025 |
872.15 (-2.14%) |
894.00 |
865.20 - 897.00 |
0.2291 times |
Fri 03 October 2025 |
891.25 (0.39%) |
881.15 |
874.45 - 921.00 |
0.4051 times |
Fri 26 September 2025 |
887.80 (-3.05%) |
851.50 |
851.50 - 937.00 |
2.1046 times |
Fri 19 September 2025 |
915.70 (3.22%) |
887.25 |
881.45 - 947.00 |
1.5573 times |
Fri 12 September 2025 |
887.15 (0.08%) |
903.85 |
875.30 - 909.00 |
0.6279 times |
Fri 05 September 2025 |
886.40 (0.29%) |
899.95 |
880.95 - 925.00 |
0.7333 times |
Fri 29 August 2025 |
883.80 (2.07%) |
867.55 |
867.55 - 946.10 |
2.8104 times |
Fri 22 August 2025 |
865.90 (-2.42%) |
889.55 |
863.65 - 897.95 |
0.6057 times |
Thu 14 August 2025 |
887.35 (1.41%) |
876.45 |
850.20 - 929.00 |
3.646 times |
Monthly price and charts Newgen Strong monthly Stock price targets for Newgen 540900 are 815.1 and 901.05 | Monthly Target 1 | 793.1 | | Monthly Target 2 | 837.1 | | Monthly Target 3 | 879.05 | | Monthly Target 4 | 923.05 | | Monthly Target 5 | 965 |
Monthly price and volumes Newgen
| Date |
Closing |
Open |
Range |
Volume |
Tue 21 October 2025 |
881.10 (-0.88%) |
894.05 |
835.05 - 921.00 |
0.2793 times |
Tue 30 September 2025 |
888.95 (0.58%) |
899.95 |
851.50 - 947.00 |
0.9493 times |
Fri 29 August 2025 |
883.80 (4.11%) |
846.70 |
815.00 - 977.35 |
3.1668 times |
Thu 31 July 2025 |
848.95 (-27.52%) |
1173.90 |
830.00 - 1174.50 |
0.7319 times |
Mon 30 June 2025 |
1171.30 (-5.27%) |
1253.75 |
1115.00 - 1335.70 |
0.8584 times |
Fri 30 May 2025 |
1236.40 (25.19%) |
982.20 |
967.65 - 1379.15 |
1.9206 times |
Wed 30 April 2025 |
987.65 (-0.72%) |
1029.80 |
850.05 - 1192.65 |
0.8125 times |
Fri 28 March 2025 |
994.80 (6.56%) |
930.05 |
916.30 - 1093.55 |
0.2783 times |
Fri 28 February 2025 |
933.55 (-10.99%) |
1020.10 |
911.10 - 1174.95 |
0.3923 times |
Fri 31 January 2025 |
1048.85 (-38.32%) |
1731.75 |
951.35 - 1795.50 |
0.6105 times |
Tue 31 December 2024 |
1700.50 (44.11%) |
1194.95 |
1150.55 - 1754.60 |
0.5102 times |

DMA SMA EMA moving averages of Newgen 540900
DMA (daily moving average) of Newgen 540900
| DMA period | DMA value | | 5 day DMA | 878.75 | | 12 day DMA | 874.13 | | 20 day DMA | 880.15 | | 35 day DMA | 885.59 | | 50 day DMA | 884.24 | | 100 day DMA | 982.41 | | 150 day DMA | 1002.5 | | 200 day DMA | 1069.4 | EMA (exponential moving average) of Newgen 540900
| EMA period | EMA current | EMA prev | EMA prev2 | | 5 day EMA | 877 | 874.95 | 872.45 | | 12 day EMA | 877.1 | 876.37 | 875.72 | | 20 day EMA | 879.34 | 879.15 | 879.07 | | 35 day EMA | 881.05 | 881.05 | 881.12 | | 50 day EMA | 883.84 | 883.95 | 884.11 |
SMA (simple moving average) of Newgen 540900
| SMA period | SMA current | SMA prev | SMA prev2 | | 5 day SMA | 878.75 | 872.45 | 869.46 | | 12 day SMA | 874.13 | 874.98 | 876.66 | | 20 day SMA | 880.15 | 881.01 | 882.79 | | 35 day SMA | 885.59 | 885.89 | 886 | | 50 day SMA | 884.24 | 884.7 | 885.78 | | 100 day SMA | 982.41 | 986.05 | 989.79 | | 150 day SMA | 1002.5 | 1003.24 | 1003.7 | | 200 day SMA | 1069.4 | 1072.92 | 1076.4 |
|
|
