Shalby 540797 full analysis,charts,indicators,moving averages,SMA,DMA,EMA,ADX,MACD,RSIShalby 540797 WideScreen charts, DMA,SMA,EMA technical analysis, forecast prediction, by indicators ADX,MACD,RSI,CCI BSE stock exchange
Daily price and charts and targets Shalby Strong Daily Stock price targets for Shalby 540797 are 250.43 and 255.08 | Daily Target 1 | 247.08 | | Daily Target 2 | 249.12 | | Daily Target 3 | 251.73333333333 | | Daily Target 4 | 253.77 | | Daily Target 5 | 256.38 |
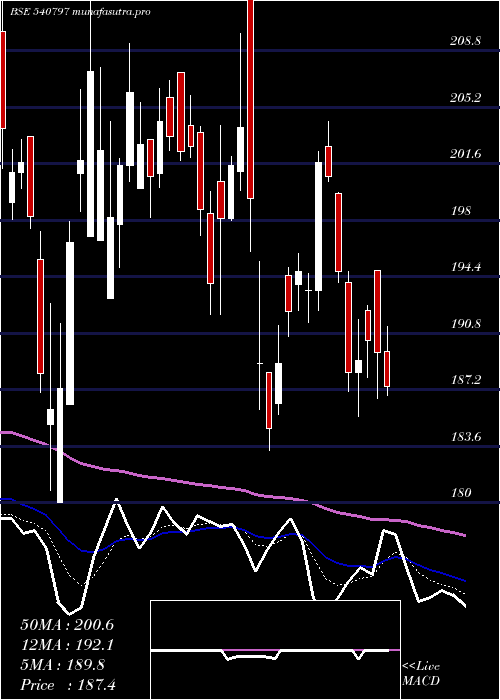
Daily price and volume Shalby
| Date |
Closing |
Open |
Range |
Volume |
Tue 21 October 2025 |
251.15 (1.54%) |
249.70 |
249.70 - 254.35 |
0.4534 times |
Mon 20 October 2025 |
247.35 (0.37%) |
249.65 |
245.30 - 249.65 |
0.6269 times |
Fri 17 October 2025 |
246.45 (-2.97%) |
250.45 |
245.00 - 251.50 |
0.5675 times |
Thu 16 October 2025 |
254.00 (3.82%) |
245.50 |
245.30 - 255.05 |
1.1435 times |
Wed 15 October 2025 |
244.65 (-1.21%) |
248.00 |
244.05 - 249.00 |
0.6955 times |
Tue 14 October 2025 |
247.65 (-2.92%) |
260.10 |
246.15 - 260.10 |
0.8961 times |
Mon 13 October 2025 |
255.10 (1.21%) |
251.00 |
249.40 - 257.30 |
0.7089 times |
Fri 10 October 2025 |
252.05 (0.06%) |
253.55 |
249.45 - 256.35 |
1.1099 times |
Thu 09 October 2025 |
251.90 (-0.79%) |
254.25 |
250.00 - 255.25 |
0.7872 times |
Wed 08 October 2025 |
253.90 (-2.89%) |
261.10 |
252.65 - 262.00 |
3.0111 times |
Tue 07 October 2025 |
261.45 (-1.21%) |
264.45 |
258.20 - 264.45 |
1.1555 times |
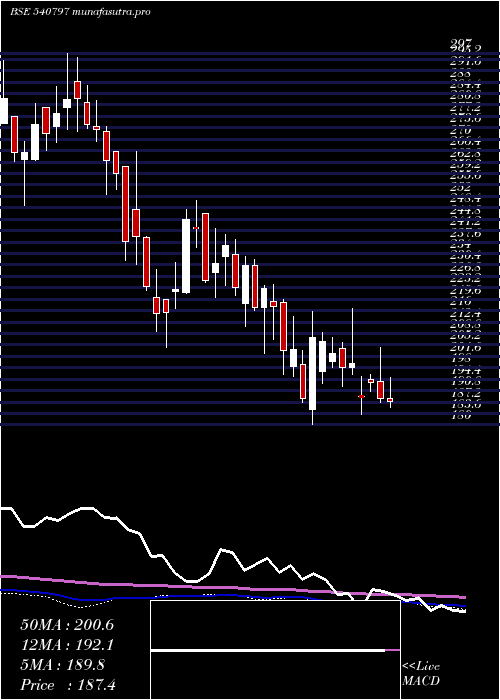
Weekly price and charts Shalby Strong weekly Stock price targets for Shalby 540797 are 248.23 and 257.28 | Weekly Target 1 | 241.22 | | Weekly Target 2 | 246.18 | | Weekly Target 3 | 250.26666666667 | | Weekly Target 4 | 255.23 | | Weekly Target 5 | 259.32 |
Weekly price and volumes for Shalby
| Date |
Closing |
Open |
Range |
Volume |
Tue 21 October 2025 |
251.15 (1.91%) |
249.65 |
245.30 - 254.35 |
0.0363 times |
Fri 17 October 2025 |
246.45 (-2.22%) |
251.00 |
244.05 - 260.10 |
0.1349 times |
Fri 10 October 2025 |
252.05 (-5.51%) |
271.45 |
249.45 - 271.45 |
0.4546 times |
Fri 03 October 2025 |
266.75 (7.91%) |
242.10 |
242.10 - 269.10 |
0.595 times |
Fri 26 September 2025 |
247.20 (2.7%) |
243.50 |
243.50 - 274.50 |
2.7687 times |
Fri 19 September 2025 |
240.70 (6.32%) |
227.25 |
225.00 - 244.00 |
0.3706 times |
Fri 12 September 2025 |
226.40 (3.31%) |
227.95 |
225.80 - 244.05 |
1.3745 times |
Fri 05 September 2025 |
219.15 (12.67%) |
188.60 |
188.60 - 229.40 |
4.13 times |
Fri 29 August 2025 |
194.50 (-1.82%) |
206.90 |
187.20 - 206.90 |
0.0536 times |
Fri 22 August 2025 |
198.10 (-2.8%) |
201.50 |
195.00 - 206.45 |
0.0819 times |
Thu 14 August 2025 |
203.80 (0.32%) |
203.15 |
200.65 - 214.25 |
0.1198 times |
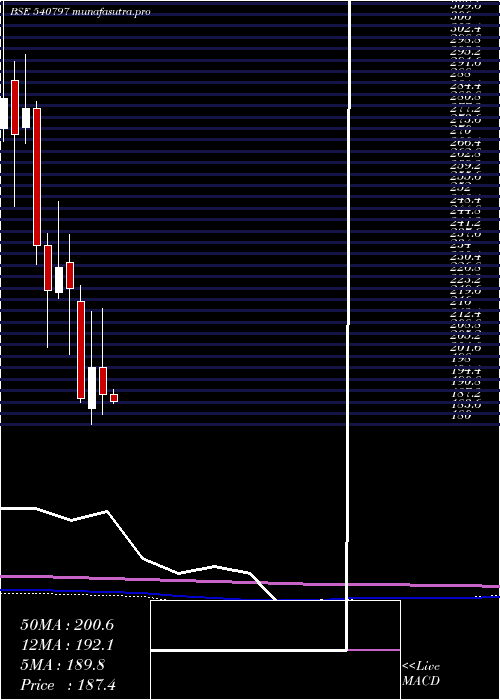
Monthly price and charts Shalby Strong monthly Stock price targets for Shalby 540797 are 233.9 and 261.3 | Monthly Target 1 | 228.15 | | Monthly Target 2 | 239.65 | | Monthly Target 3 | 255.55 | | Monthly Target 4 | 267.05 | | Monthly Target 5 | 282.95 |
Monthly price and volumes Shalby
| Date |
Closing |
Open |
Range |
Volume |
Tue 21 October 2025 |
251.15 (-5.17%) |
265.70 |
244.05 - 271.45 |
0.6317 times |
Tue 30 September 2025 |
264.85 (36.17%) |
188.60 |
188.60 - 274.50 |
6.4028 times |
Fri 29 August 2025 |
194.50 (-7.14%) |
205.05 |
187.20 - 214.25 |
0.2694 times |
Thu 31 July 2025 |
209.45 (12.88%) |
197.95 |
181.50 - 216.90 |
0.8407 times |
Mon 30 June 2025 |
185.55 (-0.67%) |
185.90 |
177.20 - 190.00 |
0.386 times |
Fri 30 May 2025 |
186.80 (-1.45%) |
189.60 |
177.25 - 205.80 |
0.4098 times |
Wed 30 April 2025 |
189.55 (-4.32%) |
198.10 |
183.35 - 216.65 |
0.2224 times |
Fri 28 March 2025 |
198.10 (5.23%) |
185.00 |
180.00 - 215.70 |
0.3386 times |
Fri 28 February 2025 |
188.25 (-15.58%) |
219.00 |
187.00 - 224.10 |
0.2499 times |
Fri 31 January 2025 |
223.00 (-2.9%) |
231.35 |
202.35 - 240.00 |
0.2488 times |
Tue 31 December 2024 |
229.65 (3.19%) |
221.70 |
220.05 - 250.65 |
0.3681 times |
DMA SMA EMA moving averages of Shalby 540797
DMA (daily moving average) of Shalby 540797
| DMA period | DMA value | | 5 day DMA | 248.72 | | 12 day DMA | 252.53 | | 20 day DMA | 254.89 | | 35 day DMA | 242.69 | | 50 day DMA | 229.61 | | 100 day DMA | 210.27 | | 150 day DMA | 205.45 | | 200 day DMA | 208.16 | EMA (exponential moving average) of Shalby 540797
| EMA period | EMA current | EMA prev | EMA prev2 | | 5 day EMA | 249.66 | 248.92 | 249.7 | | 12 day EMA | 250.86 | 250.81 | 251.44 | | 20 day EMA | 249.04 | 248.82 | 248.98 | | 35 day EMA | 240.33 | 239.69 | 239.24 | | 50 day EMA | 229.6 | 228.72 | 227.96 |
SMA (simple moving average) of Shalby 540797
| SMA period | SMA current | SMA prev | SMA prev2 | | 5 day SMA | 248.72 | 248.02 | 249.57 | | 12 day SMA | 252.53 | 253.83 | 255.28 | | 20 day SMA | 254.89 | 255.61 | 255.28 | | 35 day SMA | 242.69 | 241.13 | 239.62 | | 50 day SMA | 229.61 | 228.71 | 227.85 | | 100 day SMA | 210.27 | 209.75 | 209.27 | | 150 day SMA | 205.45 | 205.08 | 204.68 | | 200 day SMA | 208.16 | 208.01 | 207.9 |
|
|
