Khadim 540775 full analysis,charts,indicators,moving averages,SMA,DMA,EMA,ADX,MACD,RSIKhadim 540775 WideScreen charts, DMA,SMA,EMA technical analysis, forecast prediction, by indicators ADX,MACD,RSI,CCI BSE stock exchange
Daily price and charts and targets Khadim Strong Daily Stock price targets for Khadim 540775 are 238.38 and 257.03 | Daily Target 1 | 235.13 | | Daily Target 2 | 241.62 | | Daily Target 3 | 253.78333333333 | | Daily Target 4 | 260.27 | | Daily Target 5 | 272.43 |
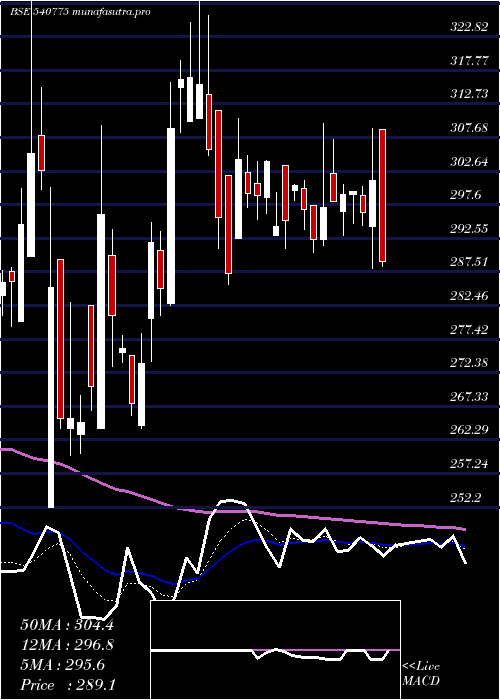
Daily price and volume Khadim
| Date |
Closing |
Open |
Range |
Volume |
Tue 21 October 2025 |
248.10 (-0.34%) |
265.95 |
247.30 - 265.95 |
0.2177 times |
Mon 20 October 2025 |
248.95 (0.75%) |
245.95 |
245.00 - 249.10 |
0.5436 times |
Fri 17 October 2025 |
247.10 (0.24%) |
248.30 |
245.30 - 250.20 |
0.4178 times |
Thu 16 October 2025 |
246.50 (0.86%) |
248.50 |
245.65 - 251.50 |
0.4831 times |
Wed 15 October 2025 |
244.40 (-0.29%) |
247.45 |
244.40 - 248.20 |
0.3212 times |
Tue 14 October 2025 |
245.10 (-1.96%) |
248.95 |
245.00 - 249.90 |
0.3137 times |
Mon 13 October 2025 |
250.00 (0.99%) |
246.55 |
246.50 - 252.50 |
0.8403 times |
Fri 10 October 2025 |
247.55 (1.21%) |
266.00 |
246.50 - 266.00 |
3.5674 times |
Thu 09 October 2025 |
244.60 (-5.12%) |
257.85 |
241.90 - 259.60 |
2.3563 times |
Wed 08 October 2025 |
257.80 (0.98%) |
256.10 |
253.00 - 259.90 |
0.939 times |
Tue 07 October 2025 |
255.30 (-2.48%) |
258.25 |
251.15 - 263.45 |
0.7185 times |
Weekly price and charts Khadim Strong weekly Stock price targets for Khadim 540775 are 246.55 and 267.5 | Weekly Target 1 | 232.07 | | Weekly Target 2 | 240.08 | | Weekly Target 3 | 253.01666666667 | | Weekly Target 4 | 261.03 | | Weekly Target 5 | 273.97 |
Weekly price and volumes for Khadim
| Date |
Closing |
Open |
Range |
Volume |
Tue 21 October 2025 |
248.10 (0.4%) |
245.95 |
245.00 - 265.95 |
0.0433 times |
Fri 17 October 2025 |
247.10 (-0.18%) |
246.55 |
244.40 - 252.50 |
0.1352 times |
Fri 10 October 2025 |
247.55 (-7.68%) |
266.55 |
241.90 - 268.10 |
0.4865 times |
Fri 03 October 2025 |
268.15 (1.9%) |
265.75 |
253.65 - 277.80 |
0.2186 times |
Fri 26 September 2025 |
263.15 (-8.33%) |
286.90 |
260.20 - 295.00 |
1.0371 times |
Fri 19 September 2025 |
287.05 (23.49%) |
233.90 |
231.40 - 294.50 |
6.5927 times |
Fri 12 September 2025 |
232.45 (-2.84%) |
239.85 |
229.05 - 244.65 |
0.3321 times |
Fri 05 September 2025 |
239.25 (-0.17%) |
239.65 |
230.95 - 249.80 |
0.5158 times |
Fri 29 August 2025 |
239.65 (0.25%) |
239.90 |
229.00 - 255.00 |
0.2398 times |
Fri 22 August 2025 |
239.05 (-4.05%) |
255.90 |
238.50 - 255.90 |
0.3988 times |
Thu 14 August 2025 |
249.15 (-4.94%) |
262.00 |
236.20 - 268.75 |
0.1527 times |
Monthly price and charts Khadim Strong monthly Stock price targets for Khadim 540775 are 227.05 and 262.95 | Monthly Target 1 | 220.03 | | Monthly Target 2 | 234.07 | | Monthly Target 3 | 255.93333333333 | | Monthly Target 4 | 269.97 | | Monthly Target 5 | 291.83 |
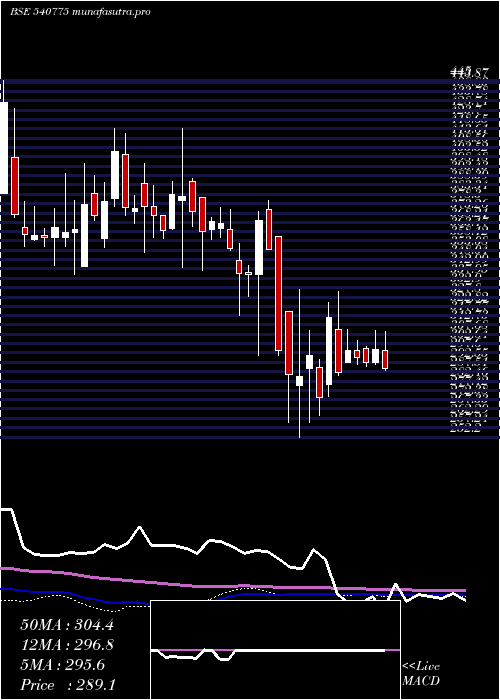
Monthly price and volumes Khadim
| Date |
Closing |
Open |
Range |
Volume |
Tue 21 October 2025 |
248.10 (-3.33%) |
256.90 |
241.90 - 277.80 |
0.3746 times |
Tue 30 September 2025 |
256.65 (7.09%) |
239.65 |
229.05 - 295.00 |
3.8553 times |
Fri 29 August 2025 |
239.65 (-11.54%) |
260.20 |
229.00 - 278.90 |
0.4595 times |
Thu 31 July 2025 |
270.90 (5.9%) |
253.10 |
252.00 - 310.70 |
1.4821 times |
Mon 30 June 2025 |
255.80 (-13.6%) |
294.60 |
251.40 - 313.15 |
0.8637 times |
Fri 30 May 2025 |
296.05 (2.4%) |
292.10 |
262.00 - 310.00 |
0.579 times |
Wed 30 April 2025 |
289.10 (0.63%) |
292.50 |
288.00 - 310.50 |
0.3536 times |
Fri 28 March 2025 |
287.30 (0.75%) |
289.35 |
259.95 - 330.80 |
0.6284 times |
Fri 28 February 2025 |
285.15 (-22.75%) |
375.00 |
252.20 - 380.00 |
0.7984 times |
Fri 31 January 2025 |
369.15 (1.55%) |
365.65 |
296.50 - 376.45 |
0.6053 times |
Tue 31 December 2024 |
363.50 (-5.22%) |
380.00 |
342.00 - 418.95 |
1.0422 times |

DMA SMA EMA moving averages of Khadim 540775
DMA (daily moving average) of Khadim 540775
| DMA period | DMA value | | 5 day DMA | 247.01 | | 12 day DMA | 249.77 | | 20 day DMA | 256.23 | | 35 day DMA | 254.43 | | 50 day DMA | 251.89 | | 100 day DMA | 263.09 | | 150 day DMA | 273.31 | | 200 day DMA | 287.82 | EMA (exponential moving average) of Khadim 540775
| EMA period | EMA current | EMA prev | EMA prev2 | | 5 day EMA | 247.91 | 247.82 | 247.25 | | 12 day EMA | 250.45 | 250.88 | 251.23 | | 20 day EMA | 252.73 | 253.22 | 253.67 | | 35 day EMA | 252.87 | 253.15 | 253.4 | | 50 day EMA | 252.63 | 252.81 | 252.97 |
SMA (simple moving average) of Khadim 540775
| SMA period | SMA current | SMA prev | SMA prev2 | | 5 day SMA | 247.01 | 246.41 | 246.62 | | 12 day SMA | 249.77 | 251.44 | 252.29 | | 20 day SMA | 256.23 | 258.27 | 260.18 | | 35 day SMA | 254.43 | 254.23 | 253.96 | | 50 day SMA | 251.89 | 252.16 | 252.48 | | 100 day SMA | 263.09 | 263.6 | 264.11 | | 150 day SMA | 273.31 | 273.42 | 273.53 | | 200 day SMA | 287.82 | 288.42 | 288.99 |
|
|
