NamIndia 540767 full analysis,charts,indicators,moving averages,SMA,DMA,EMA,ADX,MACD,RSINam India 540767 WideScreen charts, DMA,SMA,EMA technical analysis, forecast prediction, by indicators ADX,MACD,RSI,CCI BSE stock exchange
Daily price and charts and targets NamIndia Strong Daily Stock price targets for NamIndia 540767 are 910 and 962.9 | Daily Target 1 | 900.3 | | Daily Target 2 | 919.7 | | Daily Target 3 | 953.2 | | Daily Target 4 | 972.6 | | Daily Target 5 | 1006.1 |
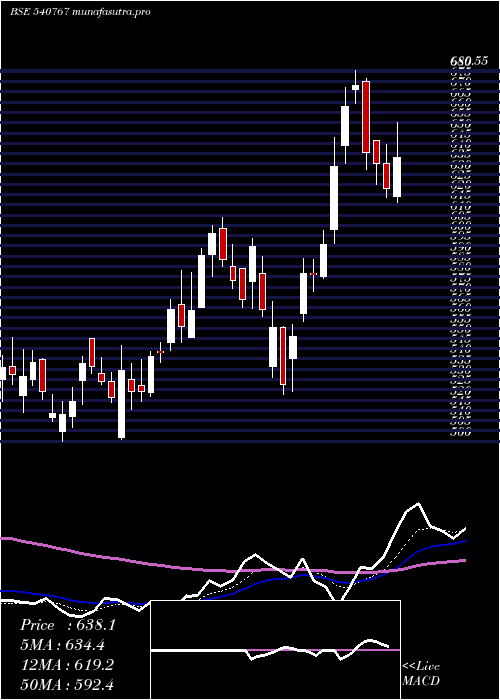
Daily price and volume Nam India
| Date |
Closing |
Open |
Range |
Volume |
Thu 23 October 2025 |
939.10 (-2.93%) |
967.65 |
933.80 - 986.70 |
0.8853 times |
Tue 21 October 2025 |
967.45 (1.73%) |
951.00 |
948.15 - 971.90 |
0.2572 times |
Mon 20 October 2025 |
951.00 (4%) |
924.35 |
915.00 - 959.00 |
1.4689 times |
Fri 17 October 2025 |
914.40 (2.99%) |
885.75 |
885.75 - 939.00 |
1.7085 times |
Thu 16 October 2025 |
887.85 (-0.89%) |
904.10 |
885.55 - 908.10 |
0.5462 times |
Wed 15 October 2025 |
895.85 (1.93%) |
878.95 |
870.90 - 908.00 |
0.4173 times |
Tue 14 October 2025 |
878.90 (-0.57%) |
886.00 |
875.00 - 910.95 |
1.3332 times |
Mon 13 October 2025 |
883.95 (1.29%) |
860.05 |
860.05 - 906.90 |
1.7431 times |
Fri 10 October 2025 |
872.65 (1.81%) |
850.05 |
850.05 - 873.85 |
1.2423 times |
Thu 09 October 2025 |
857.15 (-0.36%) |
863.95 |
850.90 - 864.60 |
0.3979 times |
Wed 08 October 2025 |
860.25 (-1.68%) |
875.00 |
856.80 - 877.50 |
0.1679 times |
Weekly price and charts NamIndia Strong weekly Stock price targets for NamIndia 540767 are 927.05 and 998.75 | Weekly Target 1 | 875.23 | | Weekly Target 2 | 907.17 | | Weekly Target 3 | 946.93333333333 | | Weekly Target 4 | 978.87 | | Weekly Target 5 | 1018.63 |
Weekly price and volumes for Nam India
| Date |
Closing |
Open |
Range |
Volume |
Thu 23 October 2025 |
939.10 (2.7%) |
924.35 |
915.00 - 986.70 |
0.631 times |
Fri 17 October 2025 |
914.40 (4.78%) |
860.05 |
860.05 - 939.00 |
1.3891 times |
Fri 10 October 2025 |
872.65 (-1.85%) |
895.25 |
850.05 - 902.80 |
0.6821 times |
Fri 03 October 2025 |
889.10 (3.77%) |
856.75 |
852.90 - 898.00 |
0.7021 times |
Fri 26 September 2025 |
856.80 (2.58%) |
841.45 |
825.05 - 863.75 |
1.6855 times |
Fri 19 September 2025 |
835.25 (0.87%) |
830.50 |
823.00 - 856.00 |
0.5943 times |
Fri 12 September 2025 |
828.05 (3.73%) |
799.10 |
795.00 - 843.20 |
0.6548 times |
Fri 05 September 2025 |
798.30 (1.71%) |
786.30 |
785.55 - 827.60 |
0.915 times |
Fri 29 August 2025 |
784.85 (-9.2%) |
869.30 |
780.80 - 870.00 |
0.8734 times |
Fri 22 August 2025 |
864.35 (7.58%) |
805.15 |
805.15 - 887.50 |
1.8727 times |
Thu 14 August 2025 |
803.45 (0.45%) |
800.00 |
792.50 - 817.15 |
0.5789 times |

Monthly price and charts NamIndia Strong monthly Stock price targets for NamIndia 540767 are 894.58 and 1031.23 | Monthly Target 1 | 788.63 | | Monthly Target 2 | 863.87 | | Monthly Target 3 | 925.28333333333 | | Monthly Target 4 | 1000.52 | | Monthly Target 5 | 1061.93 |
Monthly price and volumes Nam India
| Date |
Closing |
Open |
Range |
Volume |
Thu 23 October 2025 |
939.10 (8.16%) |
862.05 |
850.05 - 986.70 |
0.6245 times |
Tue 30 September 2025 |
868.25 (10.63%) |
786.30 |
785.55 - 880.95 |
0.8532 times |
Fri 29 August 2025 |
784.85 (-3.3%) |
812.85 |
780.80 - 887.50 |
0.9996 times |
Thu 31 July 2025 |
811.65 (1.44%) |
801.65 |
772.20 - 877.65 |
2.4638 times |
Mon 30 June 2025 |
800.10 (7.76%) |
743.90 |
715.00 - 820.35 |
0.8316 times |
Fri 30 May 2025 |
742.45 (16.35%) |
638.15 |
613.05 - 757.00 |
0.9236 times |
Wed 30 April 2025 |
638.10 (10.38%) |
584.00 |
522.60 - 680.55 |
0.9786 times |
Fri 28 March 2025 |
578.10 (12.55%) |
504.70 |
500.00 - 608.65 |
0.7235 times |
Fri 28 February 2025 |
513.65 (-12.07%) |
582.85 |
501.40 - 641.25 |
0.859 times |
Fri 31 January 2025 |
584.15 (-19.63%) |
716.05 |
550.00 - 770.50 |
0.7426 times |
Tue 31 December 2024 |
726.85 (5.97%) |
680.05 |
673.00 - 816.05 |
1.165 times |

DMA SMA EMA moving averages of Nam India 540767
DMA (daily moving average) of Nam India 540767
| DMA period | DMA value | | 5 day DMA | 931.96 | | 12 day DMA | 898.63 | | 20 day DMA | 886.59 | | 35 day DMA | 860.12 | | 50 day DMA | 848.74 | | 100 day DMA | 821.63 | | 150 day DMA | 756.86 | | 200 day DMA | 721.16 | EMA (exponential moving average) of Nam India 540767
| EMA period | EMA current | EMA prev | EMA prev2 | | 5 day EMA | 933.83 | 931.19 | 913.07 | | 12 day EMA | 908.98 | 903.51 | 891.89 | | 20 day EMA | 891.96 | 887 | 878.53 | | 35 day EMA | 871.85 | 867.89 | 862.03 | | 50 day EMA | 854.07 | 850.6 | 845.83 |
SMA (simple moving average) of Nam India 540767
| SMA period | SMA current | SMA prev | SMA prev2 | | 5 day SMA | 931.96 | 923.31 | 905.6 | | 12 day SMA | 898.63 | 893.11 | 886.58 | | 20 day SMA | 886.59 | 881.42 | 875.11 | | 35 day SMA | 860.12 | 855.88 | 851.1 | | 50 day SMA | 848.74 | 845.95 | 842.8 | | 100 day SMA | 821.63 | 819.56 | 817.23 | | 150 day SMA | 756.86 | 754.17 | 751.31 | | 200 day SMA | 721.16 | 720.23 | 719.12 |
|
|
