Capacite 540710 full analysis,charts,indicators,moving averages,SMA,DMA,EMA,ADX,MACD,RSICapacite 540710 WideScreen charts, DMA,SMA,EMA technical analysis, forecast prediction, by indicators ADX,MACD,RSI,CCI BSE stock exchange
Daily price and charts and targets Capacite Strong Daily Stock price targets for Capacite 540710 are 274.93 and 278.78 | Daily Target 1 | 271.83 | | Daily Target 2 | 274.17 | | Daily Target 3 | 275.68333333333 | | Daily Target 4 | 278.02 | | Daily Target 5 | 279.53 |
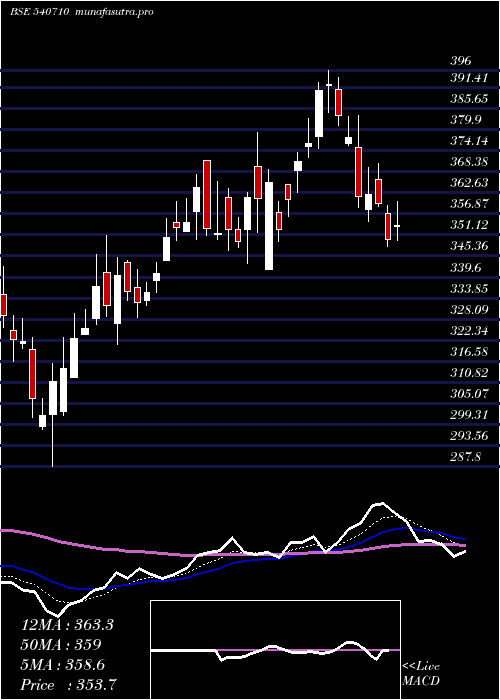
Daily price and volume Capacite
| Date |
Closing |
Open |
Range |
Volume |
Tue 21 October 2025 |
276.50 (0.99%) |
274.00 |
273.35 - 277.20 |
0.1299 times |
Mon 20 October 2025 |
273.80 (0.74%) |
271.00 |
265.55 - 276.00 |
1.7211 times |
Fri 17 October 2025 |
271.80 (-1.88%) |
273.85 |
270.70 - 278.35 |
0.9923 times |
Thu 16 October 2025 |
277.00 (-0.36%) |
278.25 |
276.20 - 281.15 |
0.2531 times |
Wed 15 October 2025 |
278.00 (0.65%) |
276.95 |
276.05 - 279.50 |
0.2644 times |
Tue 14 October 2025 |
276.20 (-2.26%) |
283.00 |
275.60 - 283.70 |
0.7908 times |
Mon 13 October 2025 |
282.60 (-1.28%) |
284.00 |
280.95 - 285.40 |
0.578 times |
Fri 10 October 2025 |
286.25 (2.38%) |
278.50 |
276.95 - 288.65 |
3.1054 times |
Thu 09 October 2025 |
279.60 (3.1%) |
273.35 |
272.40 - 280.40 |
1.2068 times |
Wed 08 October 2025 |
271.20 (-2.66%) |
275.60 |
270.60 - 281.15 |
0.9582 times |
Tue 07 October 2025 |
278.60 (-1.55%) |
281.55 |
278.00 - 285.35 |
1.7487 times |
Weekly price and charts Capacite Strong weekly Stock price targets for Capacite 540710 are 271.03 and 282.68 | Weekly Target 1 | 261.43 | | Weekly Target 2 | 268.97 | | Weekly Target 3 | 273.08333333333 | | Weekly Target 4 | 280.62 | | Weekly Target 5 | 284.73 |
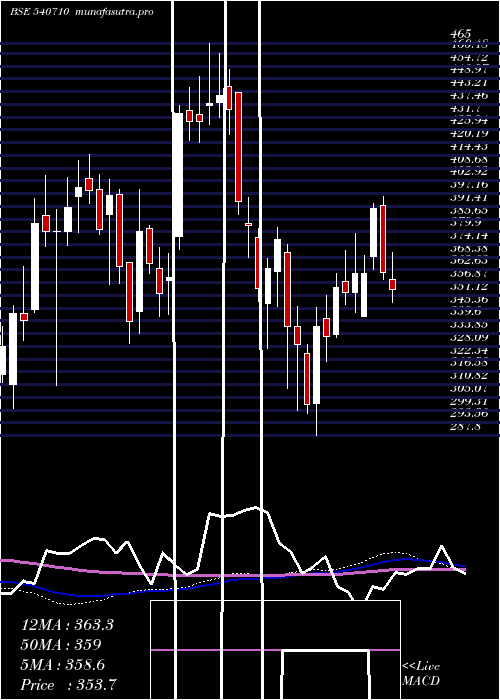
Weekly price and volumes for Capacite
| Date |
Closing |
Open |
Range |
Volume |
Tue 21 October 2025 |
276.50 (1.73%) |
271.00 |
265.55 - 277.20 |
0.2433 times |
Fri 17 October 2025 |
271.80 (-5.05%) |
284.00 |
270.70 - 285.40 |
0.3783 times |
Fri 10 October 2025 |
286.25 (-0.61%) |
287.60 |
270.60 - 288.65 |
1.2136 times |
Fri 03 October 2025 |
288.00 (-0.57%) |
290.00 |
282.00 - 293.65 |
0.6731 times |
Fri 26 September 2025 |
289.65 (-7.22%) |
312.50 |
288.85 - 319.00 |
0.9551 times |
Fri 19 September 2025 |
312.20 (4%) |
301.05 |
298.25 - 333.95 |
2.6583 times |
Fri 12 September 2025 |
300.20 (1.21%) |
299.70 |
293.60 - 313.60 |
1.1058 times |
Fri 05 September 2025 |
296.60 (5.51%) |
283.90 |
283.25 - 308.90 |
0.9714 times |
Fri 29 August 2025 |
281.10 (-6.19%) |
299.05 |
279.90 - 305.50 |
0.6487 times |
Fri 22 August 2025 |
299.65 (8.41%) |
280.00 |
277.85 - 304.30 |
1.1524 times |
Thu 14 August 2025 |
276.40 (-5.2%) |
293.40 |
275.80 - 297.95 |
1.2961 times |
Monthly price and charts Capacite Strong monthly Stock price targets for Capacite 540710 are 257.73 and 284.33 | Monthly Target 1 | 251.47 | | Monthly Target 2 | 263.98 | | Monthly Target 3 | 278.06666666667 | | Monthly Target 4 | 290.58 | | Monthly Target 5 | 304.67 |
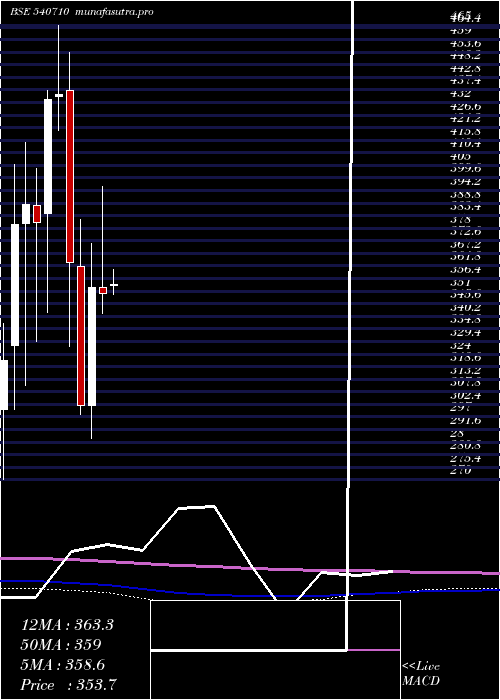
Monthly price and volumes Capacite
| Date |
Closing |
Open |
Range |
Volume |
Tue 21 October 2025 |
276.50 (-4.52%) |
290.40 |
265.55 - 292.15 |
0.3755 times |
Tue 30 September 2025 |
289.60 (3.02%) |
283.90 |
283.00 - 333.95 |
0.985 times |
Fri 29 August 2025 |
281.10 (-8.24%) |
301.00 |
275.80 - 308.05 |
0.6671 times |
Thu 31 July 2025 |
306.35 (-8.29%) |
332.60 |
295.25 - 338.50 |
0.7585 times |
Mon 30 June 2025 |
334.05 (1.58%) |
329.10 |
314.05 - 357.65 |
0.7268 times |
Fri 30 May 2025 |
328.85 (-5.99%) |
353.30 |
320.05 - 372.25 |
1.166 times |
Wed 30 April 2025 |
349.80 (-0.82%) |
352.65 |
341.60 - 396.00 |
0.844 times |
Fri 28 March 2025 |
352.70 (16.83%) |
302.05 |
287.80 - 371.45 |
1.3937 times |
Fri 28 February 2025 |
301.90 (-16.93%) |
361.75 |
297.95 - 381.95 |
1.4888 times |
Fri 31 January 2025 |
363.45 (-16.53%) |
436.95 |
327.10 - 453.25 |
1.5946 times |
Tue 31 December 2024 |
435.45 (0.48%) |
434.60 |
420.05 - 465.00 |
2.119 times |
DMA SMA EMA moving averages of Capacite 540710
DMA (daily moving average) of Capacite 540710
| DMA period | DMA value | | 5 day DMA | 275.42 | | 12 day DMA | 277.88 | | 20 day DMA | 283.5 | | 35 day DMA | 292.96 | | 50 day DMA | 291.96 | | 100 day DMA | 308.03 | | 150 day DMA | 323.54 | | 200 day DMA | 335.09 | EMA (exponential moving average) of Capacite 540710
| EMA period | EMA current | EMA prev | EMA prev2 | | 5 day EMA | 275.83 | 275.5 | 276.35 | | 12 day EMA | 279.18 | 279.67 | 280.74 | | 20 day EMA | 283.11 | 283.81 | 284.86 | | 35 day EMA | 286.47 | 287.06 | 287.84 | | 50 day EMA | 290.84 | 291.42 | 292.14 |
SMA (simple moving average) of Capacite 540710
| SMA period | SMA current | SMA prev | SMA prev2 | | 5 day SMA | 275.42 | 275.36 | 277.12 | | 12 day SMA | 277.88 | 278.84 | 279.6 | | 20 day SMA | 283.5 | 285.17 | 287.09 | | 35 day SMA | 292.96 | 293.36 | 293.57 | | 50 day SMA | 291.96 | 292.36 | 292.83 | | 100 day SMA | 308.03 | 308.71 | 309.52 | | 150 day SMA | 323.54 | 323.85 | 324.12 | | 200 day SMA | 335.09 | 335.92 | 336.74 |
|
|
