Utinext50 540669 full analysis,charts,indicators,moving averages,SMA,DMA,EMA,ADX,MACD,RSIUtinext50 540669 WideScreen charts, DMA,SMA,EMA technical analysis, forecast prediction, by indicators ADX,MACD,RSI,CCI BSE stock exchange
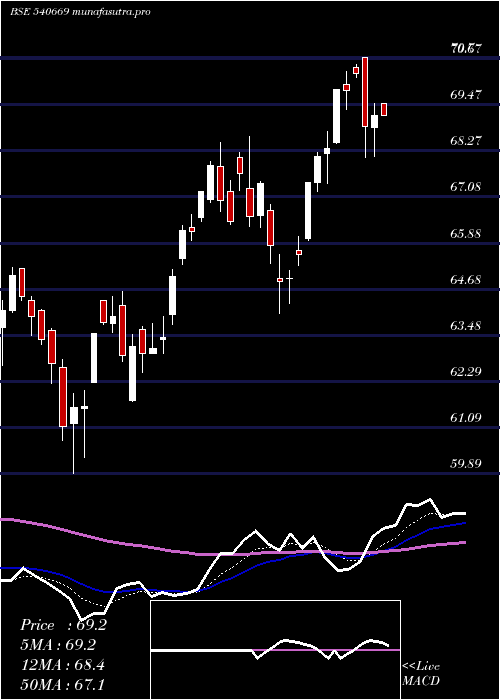
Daily price and charts and targets Utinext50 Strong Daily Stock price targets for Utinext50 540669 are 73.78 and 74.64 | Daily Target 1 | 73.06 | | Daily Target 2 | 73.64 | | Daily Target 3 | 73.923333333333 | | Daily Target 4 | 74.5 | | Daily Target 5 | 74.78 |
Daily price and volume Utinext50
| Date |
Closing |
Open |
Range |
Volume |
Fri 05 December 2025 |
74.21 (0.58%) |
73.90 |
73.35 - 74.21 |
0.2927 times |
Thu 04 December 2025 |
73.78 (0.19%) |
73.83 |
73.56 - 73.93 |
0.3752 times |
Wed 03 December 2025 |
73.64 (-0.98%) |
73.72 |
73.40 - 73.72 |
0.7851 times |
Tue 02 December 2025 |
74.37 (0.04%) |
74.52 |
73.99 - 74.52 |
7.1499 times |
Mon 01 December 2025 |
74.34 (0.19%) |
74.54 |
73.65 - 74.73 |
0.2308 times |
Fri 28 November 2025 |
74.20 (-0.05%) |
74.04 |
73.96 - 74.43 |
0.302 times |
Thu 27 November 2025 |
74.24 (-0.16%) |
74.44 |
73.72 - 74.44 |
0.4124 times |
Wed 26 November 2025 |
74.36 (1.38%) |
74.18 |
73.96 - 74.57 |
0.0061 times |
Tue 25 November 2025 |
73.35 (0.31%) |
73.10 |
73.01 - 73.35 |
0.2083 times |
Mon 24 November 2025 |
73.12 (-1.27%) |
74.01 |
73.12 - 74.29 |
0.2376 times |
Fri 21 November 2025 |
74.06 (-0.87%) |
74.07 |
73.91 - 75.17 |
0.0954 times |
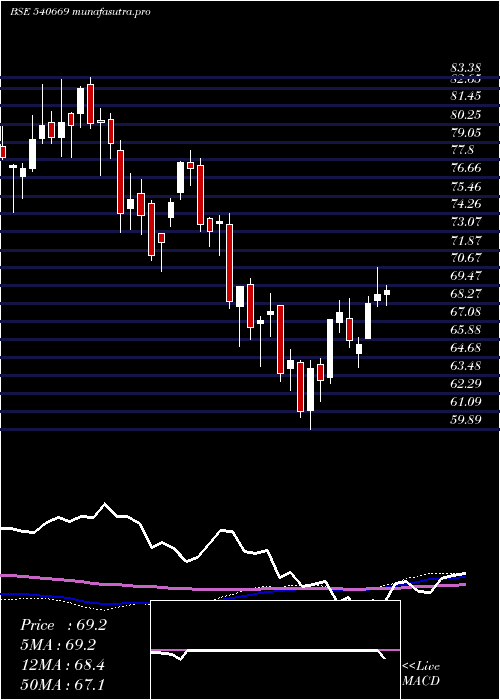
Weekly price and charts Utinext50 Strong weekly Stock price targets for Utinext50 540669 are 73.09 and 74.47 | Weekly Target 1 | 72.72 | | Weekly Target 2 | 73.46 | | Weekly Target 3 | 74.096666666667 | | Weekly Target 4 | 74.84 | | Weekly Target 5 | 75.48 |
Weekly price and volumes for Utinext50
| Date |
Closing |
Open |
Range |
Volume |
Fri 05 December 2025 |
74.21 (0.01%) |
74.54 |
73.35 - 74.73 |
2.2466 times |
Fri 28 November 2025 |
74.20 (0.19%) |
74.01 |
73.01 - 74.57 |
0.2966 times |
Fri 21 November 2025 |
74.06 (-1.4%) |
74.50 |
73.91 - 75.42 |
0.1521 times |
Fri 14 November 2025 |
75.11 (0.59%) |
73.95 |
73.95 - 75.36 |
1.1697 times |
Fri 07 November 2025 |
74.67 (-0.49%) |
75.41 |
73.72 - 75.73 |
1.0518 times |
Fri 31 October 2025 |
75.04 (0.58%) |
74.54 |
74.37 - 75.51 |
1.0463 times |
Thu 23 October 2025 |
74.61 (0.31%) |
74.57 |
74.13 - 81.85 |
1.1292 times |
Fri 17 October 2025 |
74.38 (0.64%) |
73.14 |
72.63 - 75.00 |
0.4389 times |
Fri 10 October 2025 |
73.91 (0.87%) |
73.00 |
72.73 - 74.00 |
1.5904 times |
Fri 03 October 2025 |
73.27 (1.38%) |
71.56 |
71.25 - 73.49 |
0.8783 times |
Fri 26 September 2025 |
72.27 (-3.3%) |
74.03 |
71.90 - 75.57 |
2.9108 times |
Monthly price and charts Utinext50 Strong monthly Stock price targets for Utinext50 540669 are 73.09 and 74.47 | Monthly Target 1 | 72.72 | | Monthly Target 2 | 73.46 | | Monthly Target 3 | 74.096666666667 | | Monthly Target 4 | 74.84 | | Monthly Target 5 | 75.48 |
Monthly price and volumes Utinext50
| Date |
Closing |
Open |
Range |
Volume |
Fri 05 December 2025 |
74.21 (0.01%) |
74.54 |
73.35 - 74.73 |
0.3016 times |
Fri 28 November 2025 |
74.20 (-1.12%) |
75.41 |
73.01 - 75.73 |
0.3585 times |
Fri 31 October 2025 |
75.04 (3.25%) |
73.04 |
72.59 - 81.85 |
0.6065 times |
Tue 30 September 2025 |
72.68 (3.36%) |
69.95 |
69.63 - 75.57 |
1.4027 times |
Fri 29 August 2025 |
70.32 (-2.22%) |
72.11 |
70.05 - 73.29 |
0.7468 times |
Thu 31 July 2025 |
71.92 (-2.31%) |
72.91 |
71.05 - 74.11 |
1.6103 times |
Mon 30 June 2025 |
73.62 (3.62%) |
71.48 |
70.29 - 73.98 |
1.2871 times |
Fri 30 May 2025 |
71.05 (3.41%) |
68.35 |
65.52 - 72.50 |
1.3665 times |
Wed 30 April 2025 |
68.71 (1.51%) |
67.29 |
64.06 - 70.70 |
0.9214 times |
Fri 28 March 2025 |
67.69 (10.77%) |
61.20 |
59.89 - 68.50 |
1.3987 times |
Fri 28 February 2025 |
61.11 (-9.02%) |
67.60 |
60.75 - 68.98 |
2.0582 times |

DMA SMA EMA moving averages of Utinext50 540669
DMA (daily moving average) of Utinext50 540669
| DMA period | DMA value | | 5 day DMA | 74.07 | | 12 day DMA | 74.03 | | 20 day DMA | 74.37 | | 35 day DMA | 74.55 | | 50 day DMA | 74.22 | | 100 day DMA | 73.3 | | 150 day DMA | 72.66 | | 200 day DMA | 70.89 | EMA (exponential moving average) of Utinext50 540669
| EMA period | EMA current | EMA prev | EMA prev2 | | 5 day EMA | 74.04 | 73.96 | 74.05 | | 12 day EMA | 74.15 | 74.14 | 74.21 | | 20 day EMA | 74.26 | 74.26 | 74.31 | | 35 day EMA | 74.22 | 74.22 | 74.25 | | 50 day EMA | 74.2 | 74.2 | 74.22 |
SMA (simple moving average) of Utinext50 540669
| SMA period | SMA current | SMA prev | SMA prev2 | | 5 day SMA | 74.07 | 74.07 | 74.16 | | 12 day SMA | 74.03 | 74.05 | 74.17 | | 20 day SMA | 74.37 | 74.38 | 74.44 | | 35 day SMA | 74.55 | 74.53 | 74.53 | | 50 day SMA | 74.22 | 74.24 | 74.25 | | 100 day SMA | 73.3 | 73.29 | 73.29 | | 150 day SMA | 72.66 | 72.63 | 72.59 | | 200 day SMA | 70.89 | 70.86 | 70.82 |
|
|
