Maximus 540401 full analysis,charts,indicators,moving averages,SMA,DMA,EMA,ADX,MACD,RSIMaximus 540401 WideScreen charts, DMA,SMA,EMA technical analysis, forecast prediction, by indicators ADX,MACD,RSI,CCI BSE stock exchange
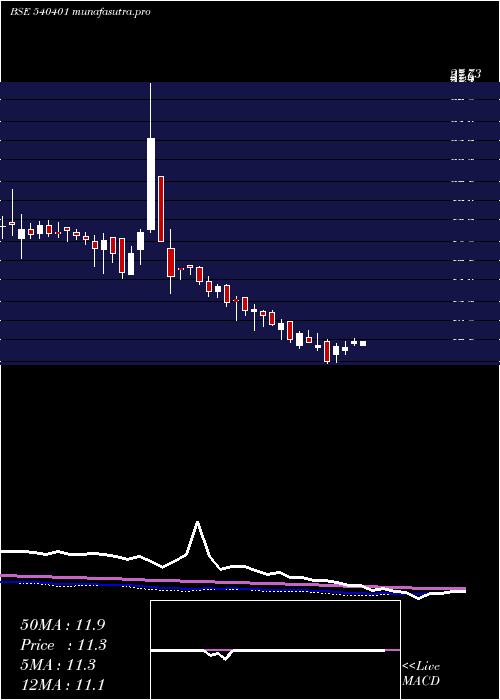
Daily price and charts and targets Maximus Strong Daily Stock price targets for Maximus 540401 are 11.58 and 11.86 | Daily Target 1 | 11.37 | | Daily Target 2 | 11.51 | | Daily Target 3 | 11.65 | | Daily Target 4 | 11.79 | | Daily Target 5 | 11.93 |
Daily price and volume Maximus
| Date |
Closing |
Open |
Range |
Volume |
Tue 21 October 2025 |
11.65 (-0.09%) |
11.51 |
11.51 - 11.79 |
0.6684 times |
Mon 20 October 2025 |
11.66 (0.34%) |
11.78 |
11.51 - 11.78 |
0.3271 times |
Fri 17 October 2025 |
11.62 (-1.11%) |
11.75 |
11.55 - 11.95 |
1.0937 times |
Thu 16 October 2025 |
11.75 (-0.51%) |
11.84 |
11.60 - 11.96 |
0.7154 times |
Wed 15 October 2025 |
11.81 (1.29%) |
11.54 |
11.54 - 12.14 |
1.0735 times |
Tue 14 October 2025 |
11.66 (-2.67%) |
11.93 |
11.60 - 12.13 |
0.6505 times |
Mon 13 October 2025 |
11.98 (1.87%) |
11.80 |
11.56 - 12.18 |
2.2039 times |
Fri 10 October 2025 |
11.76 (1.64%) |
11.55 |
11.51 - 11.86 |
1.3743 times |
Thu 09 October 2025 |
11.57 (-0.26%) |
11.66 |
11.51 - 11.66 |
0.922 times |
Wed 08 October 2025 |
11.60 (0.69%) |
11.50 |
11.49 - 11.67 |
0.9713 times |
Tue 07 October 2025 |
11.52 (-0.35%) |
11.50 |
11.45 - 11.68 |
0.6249 times |

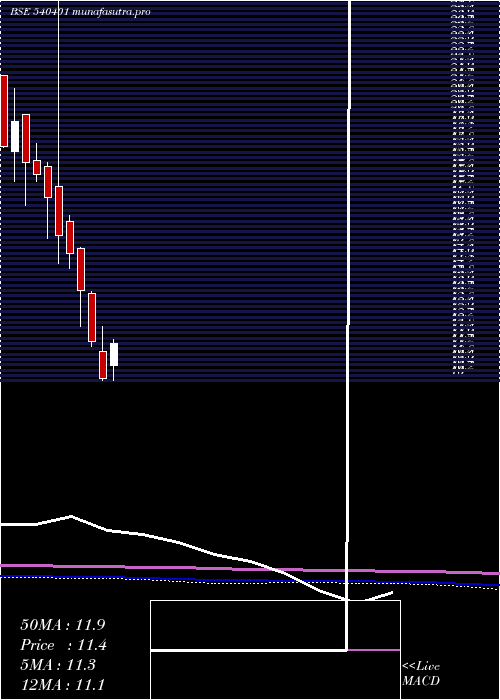
Weekly price and charts Maximus Strong weekly Stock price targets for Maximus 540401 are 11.44 and 11.72 | Weekly Target 1 | 11.37 | | Weekly Target 2 | 11.51 | | Weekly Target 3 | 11.65 | | Weekly Target 4 | 11.79 | | Weekly Target 5 | 11.93 |
Weekly price and volumes for Maximus
| Date |
Closing |
Open |
Range |
Volume |
Tue 21 October 2025 |
11.65 (0.26%) |
11.78 |
11.51 - 11.79 |
0.2046 times |
Fri 17 October 2025 |
11.62 (-1.19%) |
11.80 |
11.54 - 12.18 |
1.1789 times |
Fri 10 October 2025 |
11.76 (1.38%) |
11.35 |
11.35 - 11.86 |
0.9751 times |
Fri 03 October 2025 |
11.60 (0.43%) |
11.50 |
11.45 - 11.74 |
0.6442 times |
Fri 26 September 2025 |
11.55 (-2.12%) |
11.60 |
11.46 - 13.00 |
2.2853 times |
Fri 19 September 2025 |
11.80 (2.61%) |
11.64 |
11.50 - 12.00 |
0.8883 times |
Fri 12 September 2025 |
11.50 (-1.29%) |
11.65 |
11.45 - 11.70 |
0.8898 times |
Fri 05 September 2025 |
11.65 (0.43%) |
11.81 |
11.05 - 11.81 |
0.8921 times |
Fri 29 August 2025 |
11.60 (-0.09%) |
12.00 |
11.05 - 12.57 |
1.1153 times |
Fri 22 August 2025 |
11.61 (-3.25%) |
12.08 |
11.40 - 12.08 |
0.9264 times |
Thu 14 August 2025 |
12.00 (-0.33%) |
11.98 |
11.55 - 12.17 |
5.7374 times |
Monthly price and charts Maximus Strong monthly Stock price targets for Maximus 540401 are 11.09 and 11.92 | Monthly Target 1 | 10.9 | | Monthly Target 2 | 11.27 | | Monthly Target 3 | 11.726666666667 | | Monthly Target 4 | 12.1 | | Monthly Target 5 | 12.56 |
Monthly price and volumes Maximus
| Date |
Closing |
Open |
Range |
Volume |
Tue 21 October 2025 |
11.65 (0.78%) |
11.74 |
11.35 - 12.18 |
0.2235 times |
Tue 30 September 2025 |
11.56 (-0.34%) |
11.81 |
11.05 - 13.00 |
0.4582 times |
Fri 29 August 2025 |
11.60 (-3.17%) |
11.75 |
11.05 - 12.57 |
0.7902 times |
Thu 31 July 2025 |
11.98 (1.01%) |
11.75 |
10.95 - 12.40 |
2.6587 times |
Mon 30 June 2025 |
11.86 (2.86%) |
11.06 |
11.06 - 12.30 |
1.306 times |
Fri 30 May 2025 |
11.53 (6.56%) |
10.97 |
10.37 - 11.74 |
1.2584 times |
Wed 30 April 2025 |
10.82 (7.23%) |
10.56 |
10.01 - 11.54 |
1.3921 times |
Fri 28 March 2025 |
10.09 (-12.03%) |
11.10 |
10.00 - 12.05 |
0.9122 times |
Fri 28 February 2025 |
11.47 (-14.34%) |
13.27 |
11.29 - 13.35 |
0.3001 times |
Fri 31 January 2025 |
13.39 (-9.53%) |
14.98 |
12.05 - 15.01 |
0.7007 times |
Tue 31 December 2024 |
14.80 (-4.33%) |
15.99 |
14.22 - 16.20 |
1.428 times |
DMA SMA EMA moving averages of Maximus 540401
DMA (daily moving average) of Maximus 540401
| DMA period | DMA value | | 5 day DMA | 11.7 | | 12 day DMA | 11.68 | | 20 day DMA | 11.64 | | 35 day DMA | 11.63 | | 50 day DMA | 11.68 | | 100 day DMA | 11.68 | | 150 day DMA | 11.49 | | 200 day DMA | 11.92 | EMA (exponential moving average) of Maximus 540401
| EMA period | EMA current | EMA prev | EMA prev2 | | 5 day EMA | 11.68 | 11.69 | 11.71 | | 12 day EMA | 11.68 | 11.69 | 11.69 | | 20 day EMA | 11.67 | 11.67 | 11.67 | | 35 day EMA | 11.69 | 11.69 | 11.69 | | 50 day EMA | 11.72 | 11.72 | 11.72 |
SMA (simple moving average) of Maximus 540401
| SMA period | SMA current | SMA prev | SMA prev2 | | 5 day SMA | 11.7 | 11.7 | 11.76 | | 12 day SMA | 11.68 | 11.67 | 11.66 | | 20 day SMA | 11.64 | 11.64 | 11.65 | | 35 day SMA | 11.63 | 11.63 | 11.62 | | 50 day SMA | 11.68 | 11.69 | 11.7 | | 100 day SMA | 11.68 | 11.68 | 11.68 | | 150 day SMA | 11.49 | 11.49 | 11.48 | | 200 day SMA | 11.92 | 11.94 | 11.96 |
|
|
