Ifl 540377 full analysis,charts,indicators,moving averages,SMA,DMA,EMA,ADX,MACD,RSIIfl 540377 WideScreen charts, DMA,SMA,EMA technical analysis, forecast prediction, by indicators ADX,MACD,RSI,CCI BSE stock exchange
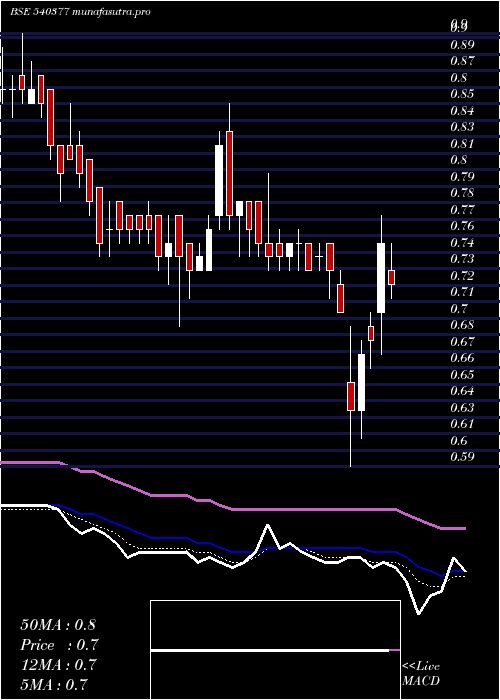
Daily price and charts and targets Ifl Strong Daily Stock price targets for Ifl 540377 are 0.66 and 0.68 | Daily Target 1 | 0.66 | | Daily Target 2 | 0.66 | | Daily Target 3 | 0.67666666666667 | | Daily Target 4 | 0.68 | | Daily Target 5 | 0.7 |
Daily price and volume Ifl
| Date |
Closing |
Open |
Range |
Volume |
Thu 23 October 2025 |
0.67 (-1.47%) |
0.68 |
0.67 - 0.69 |
0.7644 times |
Tue 21 October 2025 |
0.68 (1.49%) |
0.67 |
0.66 - 0.68 |
0.407 times |
Mon 20 October 2025 |
0.67 (0%) |
0.67 |
0.65 - 0.68 |
0.7831 times |
Fri 17 October 2025 |
0.67 (-1.47%) |
0.68 |
0.66 - 0.69 |
0.5858 times |
Thu 16 October 2025 |
0.68 (4.62%) |
0.65 |
0.65 - 0.69 |
1.113 times |
Wed 15 October 2025 |
0.65 (-2.99%) |
0.66 |
0.64 - 0.67 |
1.3735 times |
Tue 14 October 2025 |
0.67 (-5.63%) |
0.71 |
0.65 - 0.72 |
1.6939 times |
Mon 13 October 2025 |
0.71 (2.9%) |
0.69 |
0.68 - 0.72 |
1.1538 times |
Fri 10 October 2025 |
0.69 (2.99%) |
0.67 |
0.67 - 0.69 |
1.1686 times |
Thu 09 October 2025 |
0.67 (3.08%) |
0.65 |
0.64 - 0.67 |
0.957 times |
Wed 08 October 2025 |
0.65 (1.56%) |
0.64 |
0.63 - 0.67 |
2.6455 times |
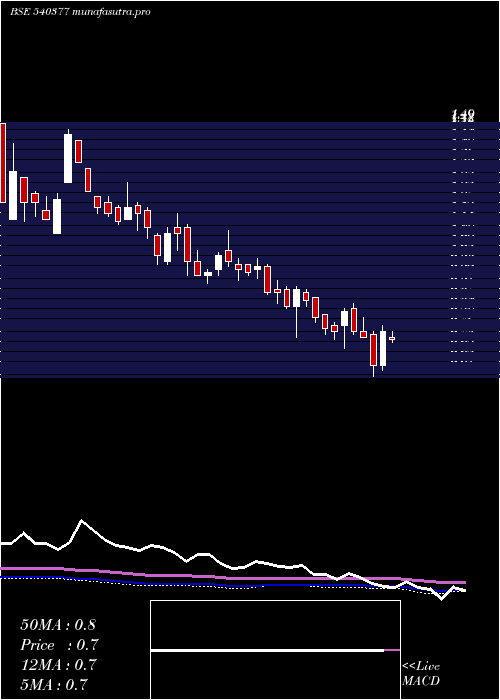
Weekly price and charts Ifl Strong weekly Stock price targets for Ifl 540377 are 0.65 and 0.69 | Weekly Target 1 | 0.63 | | Weekly Target 2 | 0.65 | | Weekly Target 3 | 0.67 | | Weekly Target 4 | 0.69 | | Weekly Target 5 | 0.71 |
Weekly price and volumes for Ifl
| Date |
Closing |
Open |
Range |
Volume |
Thu 23 October 2025 |
0.67 (0%) |
0.67 |
0.65 - 0.69 |
0.3356 times |
Fri 17 October 2025 |
0.67 (-2.9%) |
0.69 |
0.64 - 0.72 |
1.0164 times |
Fri 10 October 2025 |
0.69 (1.47%) |
0.68 |
0.63 - 0.69 |
1.4119 times |
Fri 03 October 2025 |
0.68 (-4.23%) |
0.71 |
0.66 - 0.72 |
0.7776 times |
Fri 26 September 2025 |
0.71 (-5.33%) |
0.76 |
0.70 - 0.77 |
1.0203 times |
Fri 19 September 2025 |
0.75 (2.74%) |
0.74 |
0.72 - 0.76 |
0.8367 times |
Fri 12 September 2025 |
0.73 (-5.19%) |
0.77 |
0.72 - 0.77 |
0.7849 times |
Fri 05 September 2025 |
0.77 (6.94%) |
0.73 |
0.73 - 0.78 |
0.8099 times |
Fri 29 August 2025 |
0.72 (1.41%) |
0.71 |
0.67 - 0.72 |
0.6839 times |
Fri 22 August 2025 |
0.71 (-10.13%) |
0.81 |
0.70 - 0.81 |
2.3229 times |
Thu 14 August 2025 |
0.79 (-5.95%) |
0.80 |
0.75 - 0.86 |
1.8855 times |
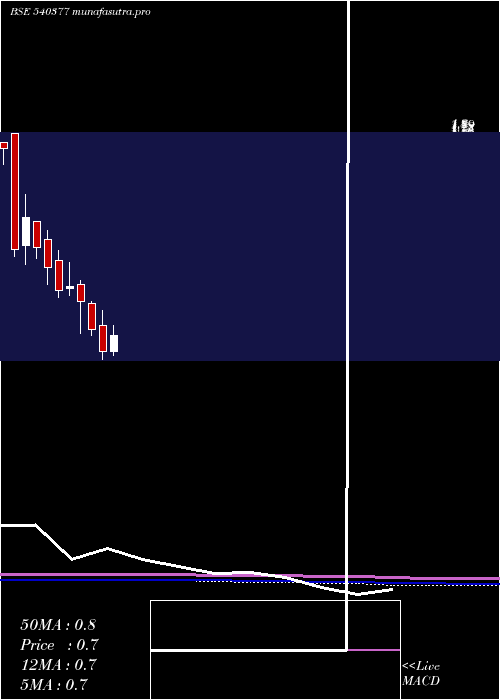
Monthly price and charts Ifl Strong monthly Stock price targets for Ifl 540377 are 0.61 and 0.7 | Monthly Target 1 | 0.58 | | Monthly Target 2 | 0.63 | | Monthly Target 3 | 0.67333333333333 | | Monthly Target 4 | 0.72 | | Monthly Target 5 | 0.76 |
Monthly price and volumes Ifl
| Date |
Closing |
Open |
Range |
Volume |
Thu 23 October 2025 |
0.67 (-4.29%) |
0.70 |
0.63 - 0.72 |
0.7314 times |
Tue 30 September 2025 |
0.70 (-2.78%) |
0.73 |
0.69 - 0.78 |
0.8239 times |
Fri 29 August 2025 |
0.72 (-24.21%) |
0.99 |
0.67 - 0.99 |
2.1258 times |
Thu 31 July 2025 |
0.95 (-19.49%) |
1.17 |
0.87 - 1.23 |
3.2696 times |
Mon 30 June 2025 |
1.18 (19.19%) |
1.10 |
1.01 - 1.39 |
1.6798 times |
Fri 30 May 2025 |
0.99 (41.43%) |
0.71 |
0.63 - 0.99 |
0.5438 times |
Wed 30 April 2025 |
0.70 (11.11%) |
0.63 |
0.61 - 0.77 |
0.1475 times |
Fri 28 March 2025 |
0.63 (-16%) |
0.77 |
0.59 - 0.85 |
0.2273 times |
Fri 28 February 2025 |
0.75 (-16.67%) |
0.89 |
0.72 - 0.90 |
0.1561 times |
Fri 31 January 2025 |
0.90 (-8.16%) |
0.99 |
0.73 - 1.01 |
0.2948 times |
Tue 31 December 2024 |
0.98 (2.08%) |
0.97 |
0.93 - 1.11 |
0.348 times |
DMA SMA EMA moving averages of Ifl 540377
DMA (daily moving average) of Ifl 540377
| DMA period | DMA value | | 5 day DMA | 0.67 | | 12 day DMA | 0.67 | | 20 day DMA | 0.68 | | 35 day DMA | 0.71 | | 50 day DMA | 0.72 | | 100 day DMA | 0.88 | | 150 day DMA | 0.83 | | 200 day DMA | 0.84 | EMA (exponential moving average) of Ifl 540377
| EMA period | EMA current | EMA prev | EMA prev2 | | 5 day EMA | 0.67 | 0.67 | 0.67 | | 12 day EMA | 0.68 | 0.68 | 0.68 | | 20 day EMA | 0.7 | 0.7 | 0.7 | | 35 day EMA | 0.73 | 0.73 | 0.73 | | 50 day EMA | 0.74 | 0.74 | 0.74 |
SMA (simple moving average) of Ifl 540377
| SMA period | SMA current | SMA prev | SMA prev2 | | 5 day SMA | 0.67 | 0.67 | 0.67 | | 12 day SMA | 0.67 | 0.67 | 0.67 | | 20 day SMA | 0.68 | 0.69 | 0.69 | | 35 day SMA | 0.71 | 0.71 | 0.71 | | 50 day SMA | 0.72 | 0.72 | 0.73 | | 100 day SMA | 0.88 | 0.89 | 0.89 | | 150 day SMA | 0.83 | 0.84 | 0.84 | | 200 day SMA | 0.84 | 0.84 | 0.84 |
|
|
