Endurance 540153 full analysis,charts,indicators,moving averages,SMA,DMA,EMA,ADX,MACD,RSIEndurance 540153 WideScreen charts, DMA,SMA,EMA technical analysis, forecast prediction, by indicators ADX,MACD,RSI,CCI BSE stock exchange
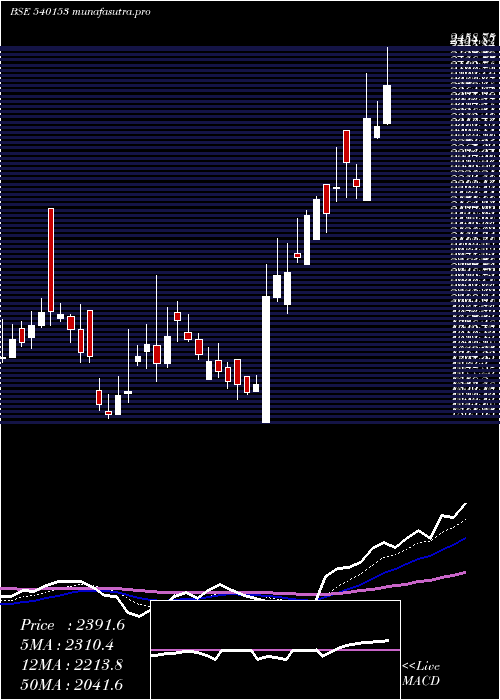
Daily price and charts and targets Endurance Strong Daily Stock price targets for Endurance 540153 are 2936.18 and 3001.03 | Daily Target 1 | 2885.9 | | Daily Target 2 | 2921.6 | | Daily Target 3 | 2950.75 | | Daily Target 4 | 2986.45 | | Daily Target 5 | 3015.6 |
Daily price and volume Endurance
| Date |
Closing |
Open |
Range |
Volume |
Thu 23 October 2025 |
2957.30 (0.22%) |
2955.30 |
2915.05 - 2979.90 |
1.1764 times |
Tue 21 October 2025 |
2950.90 (-0.46%) |
2988.95 |
2930.90 - 2992.90 |
0.4065 times |
Mon 20 October 2025 |
2964.55 (2%) |
2920.30 |
2911.65 - 2982.00 |
1.0442 times |
Fri 17 October 2025 |
2906.40 (-1.23%) |
2941.80 |
2890.00 - 2965.00 |
1.3028 times |
Thu 16 October 2025 |
2942.60 (4.2%) |
2834.25 |
2824.10 - 2955.00 |
2.305 times |
Wed 15 October 2025 |
2824.10 (1.69%) |
2752.75 |
2748.00 - 2837.05 |
0.8766 times |
Tue 14 October 2025 |
2777.30 (-2.43%) |
2850.00 |
2762.50 - 2860.30 |
0.5461 times |
Mon 13 October 2025 |
2846.50 (-1.41%) |
2896.05 |
2836.65 - 2902.05 |
0.6489 times |
Fri 10 October 2025 |
2887.25 (-1.73%) |
2914.00 |
2870.90 - 2932.05 |
0.6586 times |
Thu 09 October 2025 |
2938.20 (0.52%) |
2924.05 |
2882.05 - 2945.00 |
1.035 times |
Wed 08 October 2025 |
2923.10 (-1.02%) |
2954.00 |
2903.40 - 2977.60 |
4.5874 times |
Weekly price and charts Endurance Strong weekly Stock price targets for Endurance 540153 are 2934.48 and 3015.73 | Weekly Target 1 | 2872.7 | | Weekly Target 2 | 2915 | | Weekly Target 3 | 2953.95 | | Weekly Target 4 | 2996.25 | | Weekly Target 5 | 3035.2 |
Weekly price and volumes for Endurance
| Date |
Closing |
Open |
Range |
Volume |
Thu 23 October 2025 |
2957.30 (1.75%) |
2920.30 |
2911.65 - 2992.90 |
0.2034 times |
Fri 17 October 2025 |
2906.40 (0.66%) |
2896.05 |
2748.00 - 2965.00 |
0.4398 times |
Fri 10 October 2025 |
2887.25 (-0.2%) |
2921.95 |
2855.45 - 3008.00 |
0.8111 times |
Fri 03 October 2025 |
2893.00 (5.78%) |
2747.00 |
2682.25 - 2900.80 |
0.7031 times |
Fri 26 September 2025 |
2735.00 (-4.96%) |
2880.00 |
2667.05 - 2929.00 |
1.853 times |
Fri 19 September 2025 |
2877.65 (0.43%) |
2861.00 |
2831.10 - 2956.00 |
1.0335 times |
Fri 12 September 2025 |
2865.45 (-3.5%) |
2975.00 |
2854.60 - 3078.95 |
0.9581 times |
Fri 05 September 2025 |
2969.25 (3.53%) |
2879.00 |
2820.00 - 3023.65 |
1.3775 times |
Fri 29 August 2025 |
2868.05 (1.31%) |
2834.05 |
2750.05 - 2936.10 |
0.6355 times |
Fri 22 August 2025 |
2831.00 (8.54%) |
2655.00 |
2627.90 - 2927.75 |
1.9849 times |
Thu 14 August 2025 |
2608.15 (3.69%) |
2539.95 |
2493.45 - 2663.95 |
0.3454 times |
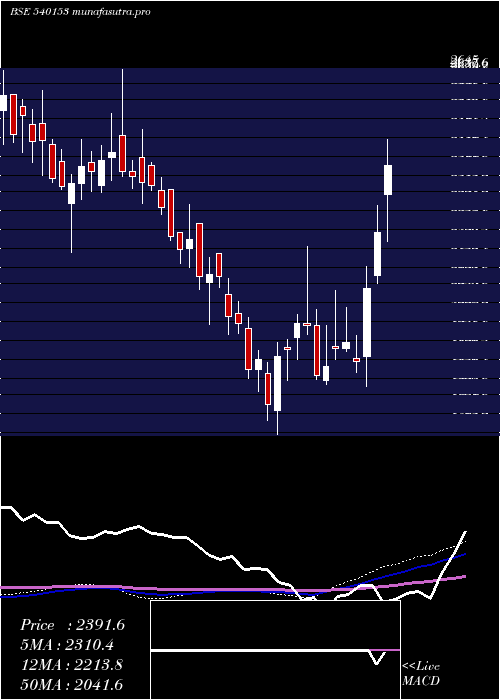
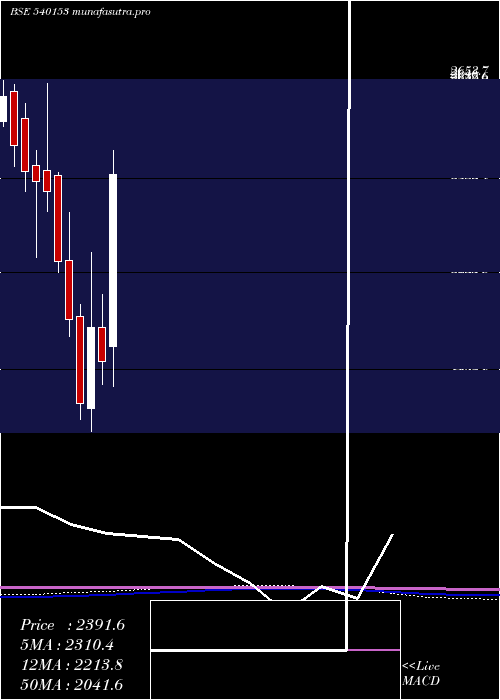
Monthly price and charts Endurance Strong monthly Stock price targets for Endurance 540153 are 2834.65 and 3130.65 | Monthly Target 1 | 2596.43 | | Monthly Target 2 | 2776.87 | | Monthly Target 3 | 2892.4333333333 | | Monthly Target 4 | 3072.87 | | Monthly Target 5 | 3188.43 |
Monthly price and volumes Endurance
| Date |
Closing |
Open |
Range |
Volume |
Thu 23 October 2025 |
2957.30 (7.66%) |
2712.00 |
2712.00 - 3008.00 |
0.7647 times |
Tue 30 September 2025 |
2747.00 (-4.22%) |
2879.00 |
2667.05 - 3078.95 |
2.3802 times |
Fri 29 August 2025 |
2868.05 (12.09%) |
2520.05 |
2463.35 - 2936.10 |
1.5667 times |
Thu 31 July 2025 |
2558.70 (-7.69%) |
2795.75 |
2456.00 - 3029.85 |
1.4608 times |
Mon 30 June 2025 |
2772.00 (14.09%) |
2474.95 |
2375.05 - 2816.00 |
1.3453 times |
Fri 30 May 2025 |
2429.70 (29.55%) |
1915.00 |
1805.05 - 2515.00 |
0.8881 times |
Wed 30 April 2025 |
1875.45 (-4.68%) |
1967.45 |
1811.00 - 2060.00 |
0.4389 times |
Fri 28 March 2025 |
1967.45 (11.84%) |
1743.35 |
1680.00 - 2176.95 |
0.3817 times |
Fri 28 February 2025 |
1759.20 (-11.61%) |
1998.40 |
1715.00 - 2032.05 |
0.3659 times |
Fri 31 January 2025 |
1990.30 (-7.49%) |
2153.45 |
1943.00 - 2288.20 |
0.4077 times |
Tue 31 December 2024 |
2151.40 (-8.27%) |
2390.75 |
2120.05 - 2398.75 |
0.2465 times |
DMA SMA EMA moving averages of Endurance 540153
DMA (daily moving average) of Endurance 540153
| DMA period | DMA value | | 5 day DMA | 2944.35 | | 12 day DMA | 2905.94 | | 20 day DMA | 2858.45 | | 35 day DMA | 2884.35 | | 50 day DMA | 2851.15 | | 100 day DMA | 2719.05 | | 150 day DMA | 2488.51 | | 200 day DMA | 2363.69 | EMA (exponential moving average) of Endurance 540153
| EMA period | EMA current | EMA prev | EMA prev2 | | 5 day EMA | 2935.44 | 2924.51 | 2911.32 | | 12 day EMA | 2904.94 | 2895.42 | 2885.34 | | 20 day EMA | 2886.2 | 2878.72 | 2871.13 | | 35 day EMA | 2854.58 | 2848.53 | 2842.5 | | 50 day EMA | 2836.7 | 2831.78 | 2826.92 |
SMA (simple moving average) of Endurance 540153
| SMA period | SMA current | SMA prev | SMA prev2 | | 5 day SMA | 2944.35 | 2917.71 | 2882.99 | | 12 day SMA | 2905.94 | 2898.87 | 2894.05 | | 20 day SMA | 2858.45 | 2853.27 | 2848.27 | | 35 day SMA | 2884.35 | 2883.2 | 2882.84 | | 50 day SMA | 2851.15 | 2842.31 | 2833.63 | | 100 day SMA | 2719.05 | 2713.87 | 2708.58 | | 150 day SMA | 2488.51 | 2481.12 | 2473.37 | | 200 day SMA | 2363.69 | 2359.8 | 2355.81 |
|
|
