Tvvision 540083 full analysis,charts,indicators,moving averages,SMA,DMA,EMA,ADX,MACD,RSITvvision 540083 WideScreen charts, DMA,SMA,EMA technical analysis, forecast prediction, by indicators ADX,MACD,RSI,CCI BSE stock exchange
Daily price and charts and targets Tvvision Strong Daily Stock price targets for Tvvision 540083 are 6.28 and 6.5 | Daily Target 1 | 6.24 | | Daily Target 2 | 6.32 | | Daily Target 3 | 6.46 | | Daily Target 4 | 6.54 | | Daily Target 5 | 6.68 |
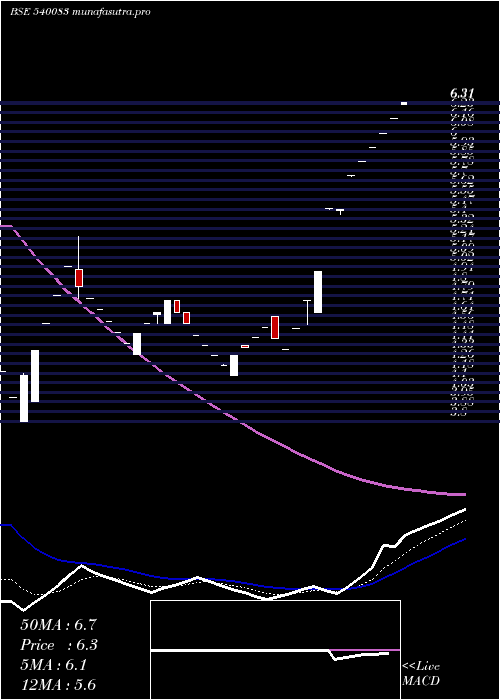
Daily price and volume Tvvision
| Date |
Closing |
Open |
Range |
Volume |
Tue 21 October 2025 |
6.40 (-2.29%) |
6.50 |
6.38 - 6.60 |
0.7516 times |
Mon 20 October 2025 |
6.55 (0.61%) |
6.51 |
6.51 - 6.55 |
0.0036 times |
Fri 17 October 2025 |
6.51 (1.72%) |
6.40 |
6.32 - 6.51 |
0.2386 times |
Thu 16 October 2025 |
6.40 (-0.31%) |
6.31 |
6.30 - 6.59 |
0.6707 times |
Wed 15 October 2025 |
6.42 (0.16%) |
6.44 |
6.40 - 6.44 |
0.1977 times |
Tue 14 October 2025 |
6.41 (1.58%) |
6.49 |
6.35 - 6.49 |
0.6088 times |
Mon 13 October 2025 |
6.31 (-5.96%) |
6.71 |
6.29 - 6.71 |
0.6526 times |
Fri 10 October 2025 |
6.71 (1.36%) |
6.50 |
6.50 - 6.80 |
0.7992 times |
Thu 09 October 2025 |
6.62 (-1.19%) |
6.50 |
6.50 - 7.20 |
4.7689 times |
Wed 08 October 2025 |
6.70 (-1.47%) |
6.35 |
6.30 - 7.47 |
1.3084 times |
Mon 06 October 2025 |
6.80 (2.41%) |
6.32 |
6.32 - 6.80 |
0.2405 times |
Weekly price and charts Tvvision Strong weekly Stock price targets for Tvvision 540083 are 6.28 and 6.5 | Weekly Target 1 | 6.24 | | Weekly Target 2 | 6.32 | | Weekly Target 3 | 6.46 | | Weekly Target 4 | 6.54 | | Weekly Target 5 | 6.68 |
Weekly price and volumes for Tvvision
| Date |
Closing |
Open |
Range |
Volume |
Tue 21 October 2025 |
6.40 (-1.69%) |
6.51 |
6.38 - 6.60 |
0.0955 times |
Fri 17 October 2025 |
6.51 (-2.98%) |
6.71 |
6.29 - 6.71 |
0.2995 times |
Fri 10 October 2025 |
6.71 (1.05%) |
6.32 |
6.30 - 7.47 |
0.8999 times |
Fri 03 October 2025 |
6.64 (-5.14%) |
7.13 |
6.36 - 7.13 |
0.469 times |
Fri 26 September 2025 |
7.00 (2.04%) |
7.19 |
6.31 - 7.36 |
0.3141 times |
Fri 19 September 2025 |
6.86 (0.44%) |
6.61 |
6.61 - 7.89 |
3.1117 times |
Fri 12 September 2025 |
6.83 (8.76%) |
6.47 |
6.02 - 6.83 |
0.8487 times |
Fri 05 September 2025 |
6.28 (-3.09%) |
6.39 |
6.01 - 6.50 |
0.9483 times |
Fri 29 August 2025 |
6.48 (-1.22%) |
6.60 |
6.20 - 6.95 |
1.2042 times |
Fri 22 August 2025 |
6.56 (-1.94%) |
7.00 |
6.49 - 7.23 |
1.8091 times |
Thu 14 August 2025 |
6.69 (-2.62%) |
6.90 |
6.59 - 7.31 |
0.444 times |

Monthly price and charts Tvvision Strong monthly Stock price targets for Tvvision 540083 are 5.81 and 6.99 | Monthly Target 1 | 5.54 | | Monthly Target 2 | 5.97 | | Monthly Target 3 | 6.72 | | Monthly Target 4 | 7.15 | | Monthly Target 5 | 7.9 |
Monthly price and volumes Tvvision
| Date |
Closing |
Open |
Range |
Volume |
Tue 21 October 2025 |
6.40 (-4.19%) |
6.40 |
6.29 - 7.47 |
0.1758 times |
Tue 30 September 2025 |
6.68 (3.09%) |
6.39 |
6.01 - 7.89 |
0.6785 times |
Fri 29 August 2025 |
6.48 (-15.18%) |
7.28 |
6.20 - 7.78 |
0.5519 times |
Thu 31 July 2025 |
7.64 (6.56%) |
7.18 |
6.81 - 9.26 |
0.884 times |
Mon 30 June 2025 |
7.17 (4.82%) |
6.50 |
6.50 - 8.84 |
1.0031 times |
Fri 30 May 2025 |
6.84 (-5.13%) |
7.35 |
6.37 - 7.93 |
0.8929 times |
Wed 30 April 2025 |
7.21 (59.16%) |
4.75 |
4.56 - 7.21 |
0.7951 times |
Fri 28 March 2025 |
4.53 (0.67%) |
4.41 |
4.16 - 4.75 |
0.648 times |
Fri 28 February 2025 |
4.50 (-31.71%) |
5.96 |
3.80 - 5.98 |
3.8684 times |
Fri 31 January 2025 |
6.59 (-68.97%) |
20.18 |
6.59 - 20.18 |
0.5022 times |
Tue 31 December 2024 |
21.24 (-18.43%) |
26.56 |
21.24 - 29.89 |
0.3644 times |

DMA SMA EMA moving averages of Tvvision 540083
DMA (daily moving average) of Tvvision 540083
| DMA period | DMA value | | 5 day DMA | 6.46 | | 12 day DMA | 6.54 | | 20 day DMA | 6.66 | | 35 day DMA | 6.65 | | 50 day DMA | 6.68 | | 100 day DMA | 7.18 | | 150 day DMA | 6.78 | | 200 day DMA | 7.69 | EMA (exponential moving average) of Tvvision 540083
| EMA period | EMA current | EMA prev | EMA prev2 | | 5 day EMA | 6.47 | 6.5 | 6.48 | | 12 day EMA | 6.54 | 6.57 | 6.57 | | 20 day EMA | 6.6 | 6.62 | 6.63 | | 35 day EMA | 6.65 | 6.66 | 6.67 | | 50 day EMA | 6.72 | 6.73 | 6.74 |
SMA (simple moving average) of Tvvision 540083
| SMA period | SMA current | SMA prev | SMA prev2 | | 5 day SMA | 6.46 | 6.46 | 6.41 | | 12 day SMA | 6.54 | 6.56 | 6.57 | | 20 day SMA | 6.66 | 6.68 | 6.72 | | 35 day SMA | 6.65 | 6.65 | 6.65 | | 50 day SMA | 6.68 | 6.7 | 6.71 | | 100 day SMA | 7.18 | 7.19 | 7.19 | | 150 day SMA | 6.78 | 6.77 | 6.76 | | 200 day SMA | 7.69 | 7.79 | 7.88 |
|
|
