Halder 539854 full analysis,charts,indicators,moving averages,SMA,DMA,EMA,ADX,MACD,RSIHalder 539854 WideScreen charts, DMA,SMA,EMA technical analysis, forecast prediction, by indicators ADX,MACD,RSI,CCI BSE stock exchange
Daily price and charts and targets Halder Strong Daily Stock price targets for Halder 539854 are 221.7 and 228.35 | Daily Target 1 | 216.87 | | Daily Target 2 | 219.88 | | Daily Target 3 | 223.51666666667 | | Daily Target 4 | 226.53 | | Daily Target 5 | 230.17 |
Daily price and volume Halder
| Date |
Closing |
Open |
Range |
Volume |
Thu 23 October 2025 |
222.90 (-1.87%) |
220.50 |
220.50 - 227.15 |
0.9414 times |
Tue 21 October 2025 |
227.15 (4.13%) |
222.60 |
216.05 - 230.00 |
1.1298 times |
Mon 20 October 2025 |
218.15 (1.96%) |
212.50 |
208.05 - 229.75 |
0.9232 times |
Fri 17 October 2025 |
213.95 (0.78%) |
215.00 |
211.60 - 215.90 |
0.8239 times |
Thu 16 October 2025 |
212.30 (-1.14%) |
214.75 |
211.00 - 216.25 |
0.9146 times |
Wed 15 October 2025 |
214.75 (-2.03%) |
221.20 |
213.05 - 229.90 |
1.1579 times |
Tue 14 October 2025 |
219.20 (-0.36%) |
224.80 |
215.25 - 229.00 |
0.9461 times |
Mon 13 October 2025 |
220.00 (0.11%) |
222.00 |
218.00 - 228.50 |
0.9757 times |
Fri 10 October 2025 |
219.75 (0.92%) |
218.00 |
216.60 - 221.95 |
1.1084 times |
Thu 09 October 2025 |
217.75 (2.91%) |
210.00 |
210.00 - 218.85 |
1.0789 times |
Wed 08 October 2025 |
211.60 (-0.61%) |
209.00 |
209.00 - 215.00 |
0.9856 times |
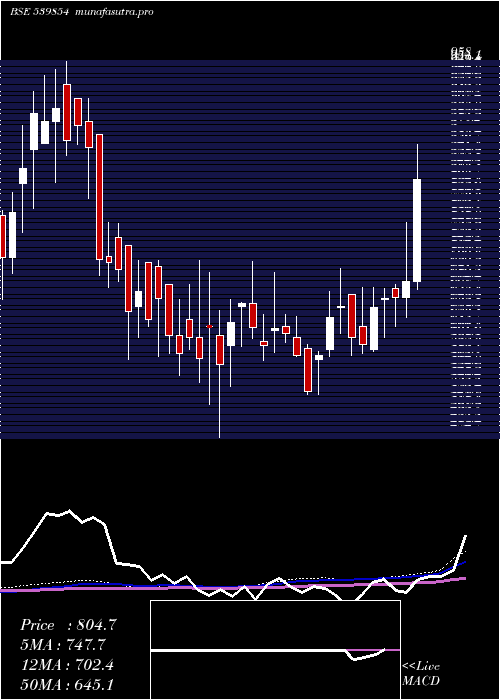
Weekly price and charts Halder Strong weekly Stock price targets for Halder 539854 are 215.48 and 237.43 | Weekly Target 1 | 198.37 | | Weekly Target 2 | 210.63 | | Weekly Target 3 | 220.31666666667 | | Weekly Target 4 | 232.58 | | Weekly Target 5 | 242.27 |
Weekly price and volumes for Halder
| Date |
Closing |
Open |
Range |
Volume |
Thu 23 October 2025 |
222.90 (4.18%) |
212.50 |
208.05 - 230.00 |
0.777 times |
Fri 17 October 2025 |
213.95 (-2.64%) |
222.00 |
211.00 - 229.90 |
1.2503 times |
Fri 10 October 2025 |
219.75 (2.73%) |
212.85 |
208.30 - 221.95 |
1.3215 times |
Fri 03 October 2025 |
213.90 (0.26%) |
211.00 |
207.00 - 220.30 |
0.7477 times |
Fri 26 September 2025 |
213.35 (-2.89%) |
214.25 |
201.25 - 225.95 |
0.6347 times |
Fri 19 September 2025 |
219.70 (4.4%) |
210.00 |
191.10 - 225.00 |
0.9607 times |
Fri 12 September 2025 |
210.45 (-15.97%) |
252.00 |
205.10 - 252.00 |
0.9225 times |
Fri 05 September 2025 |
250.45 (-68.7%) |
819.80 |
245.00 - 845.00 |
2.6545 times |
Fri 29 August 2025 |
800.05 (-0.38%) |
819.00 |
795.80 - 819.00 |
0.4935 times |
Fri 22 August 2025 |
803.10 (-0.14%) |
817.95 |
795.00 - 823.90 |
0.2377 times |
Thu 14 August 2025 |
804.20 (0.68%) |
808.00 |
800.00 - 824.95 |
0.2083 times |
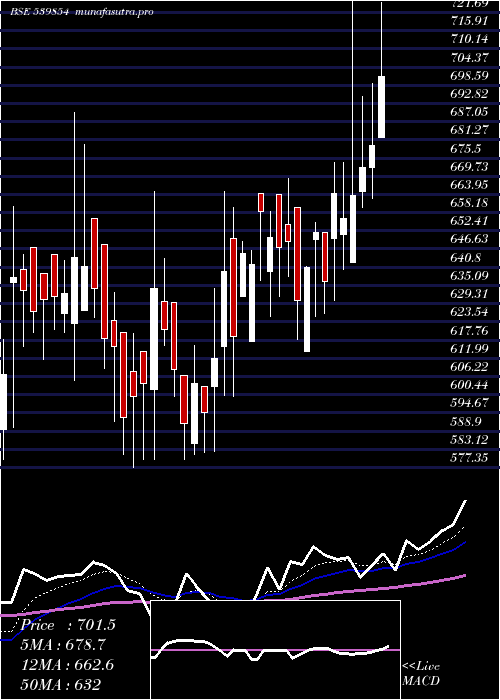
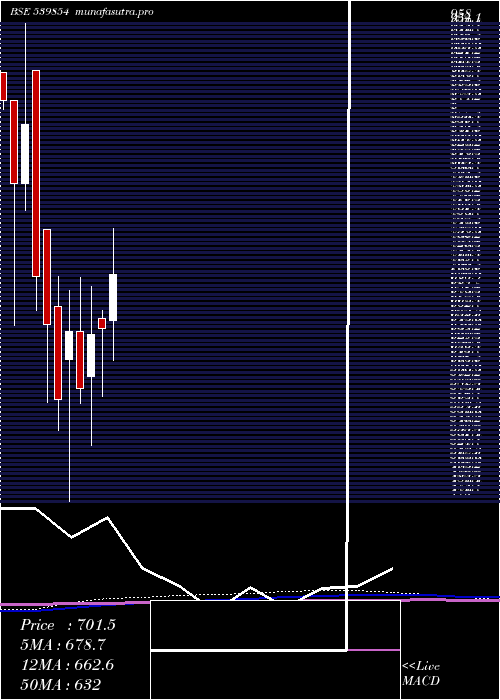
Monthly price and charts Halder Strong monthly Stock price targets for Halder 539854 are 215.48 and 237.43 | Monthly Target 1 | 198.37 | | Monthly Target 2 | 210.63 | | Monthly Target 3 | 220.31666666667 | | Monthly Target 4 | 232.58 | | Monthly Target 5 | 242.27 |
Monthly price and volumes Halder
| Date |
Closing |
Open |
Range |
Volume |
Thu 23 October 2025 |
222.90 (5.09%) |
215.75 |
208.05 - 230.00 |
1.375 times |
Tue 30 September 2025 |
212.10 (-73.49%) |
819.80 |
191.10 - 845.00 |
2.1025 times |
Fri 29 August 2025 |
800.05 (1.85%) |
798.95 |
780.05 - 829.00 |
0.4947 times |
Thu 31 July 2025 |
785.50 (21.39%) |
654.35 |
614.25 - 860.00 |
1.0223 times |
Mon 30 June 2025 |
647.10 (0.96%) |
656.50 |
577.35 - 665.00 |
1.2056 times |
Fri 30 May 2025 |
640.95 (9.58%) |
597.90 |
527.00 - 690.00 |
1.7413 times |
Wed 30 April 2025 |
584.90 (-9.13%) |
643.70 |
570.00 - 698.80 |
1.0647 times |
Fri 28 March 2025 |
643.70 (12.21%) |
614.95 |
470.00 - 684.95 |
0.6095 times |
Fri 28 February 2025 |
573.65 (-11.85%) |
668.95 |
542.05 - 700.00 |
0.1863 times |
Fri 31 January 2025 |
650.80 (-7.05%) |
748.00 |
571.20 - 748.00 |
0.1982 times |
Tue 31 December 2024 |
700.15 (-18.11%) |
910.50 |
665.00 - 910.50 |
0.26 times |
DMA SMA EMA moving averages of Halder 539854
DMA (daily moving average) of Halder 539854
| DMA period | DMA value | | 5 day DMA | 218.89 | | 12 day DMA | 217.53 | | 20 day DMA | 215.61 | | 35 day DMA | 220.43 | | 50 day DMA | 386.19 | | 100 day DMA | 539.68 | | 150 day DMA | 557.88 | | 200 day DMA | 577.89 | EMA (exponential moving average) of Halder 539854
| EMA period | EMA current | EMA prev | EMA prev2 | | 5 day EMA | 220.77 | 219.71 | 215.99 | | 12 day EMA | 219.79 | 219.23 | 217.79 | | 20 day EMA | 234.6 | 235.83 | 236.74 | | 35 day EMA | 320.47 | 326.21 | 332.04 | | 50 day EMA | 403.47 | 410.84 | 418.33 |
SMA (simple moving average) of Halder 539854
| SMA period | SMA current | SMA prev | SMA prev2 | | 5 day SMA | 218.89 | 217.26 | 215.67 | | 12 day SMA | 217.53 | 216.82 | 215.71 | | 20 day SMA | 215.61 | 215.03 | 214.45 | | 35 day SMA | 220.43 | 223.03 | 239.87 | | 50 day SMA | 386.19 | 397.71 | 408.98 | | 100 day SMA | 539.68 | 543.89 | 547.95 | | 150 day SMA | 557.88 | 560.6 | 563.25 | | 200 day SMA | 577.89 | 580.32 | 582.54 |
|
|
