Chdchem 539800 full analysis,charts,indicators,moving averages,SMA,DMA,EMA,ADX,MACD,RSIChdchem 539800 WideScreen charts, DMA,SMA,EMA technical analysis, forecast prediction, by indicators ADX,MACD,RSI,CCI BSE stock exchange
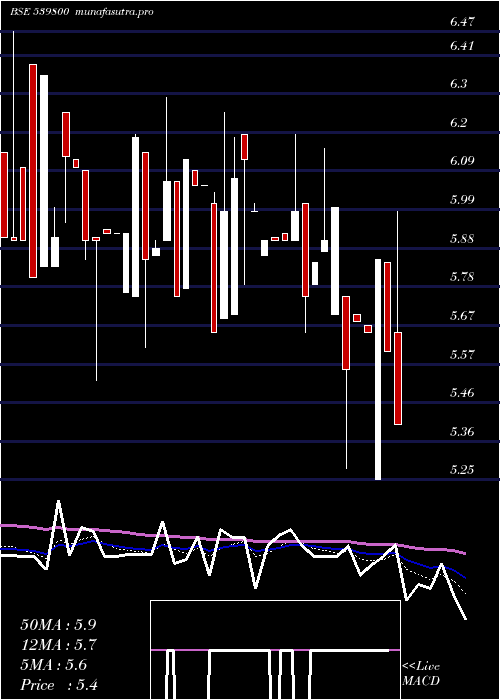
Daily price and charts and targets Chdchem Strong Daily Stock price targets for Chdchem 539800 are 5.49 and 5.87 | Daily Target 1 | 5.4 | | Daily Target 2 | 5.57 | | Daily Target 3 | 5.7766666666667 | | Daily Target 4 | 5.95 | | Daily Target 5 | 6.16 |
Daily price and volume Chdchem
| Date |
Closing |
Open |
Range |
Volume |
Thu 23 October 2025 |
5.75 (4.55%) |
5.98 |
5.60 - 5.98 |
1.7084 times |
Tue 21 October 2025 |
5.50 (-3.51%) |
5.50 |
5.50 - 5.50 |
0.2174 times |
Mon 20 October 2025 |
5.70 (5.36%) |
5.41 |
5.41 - 5.74 |
0.2676 times |
Fri 17 October 2025 |
5.41 (0%) |
5.95 |
5.15 - 5.95 |
0.3285 times |
Thu 16 October 2025 |
5.41 (-4.25%) |
5.89 |
5.26 - 5.89 |
0.0033 times |
Wed 15 October 2025 |
5.65 (4.63%) |
5.70 |
5.60 - 5.70 |
0.6121 times |
Tue 14 October 2025 |
5.40 (-4.42%) |
5.07 |
5.07 - 5.51 |
1.689 times |
Mon 13 October 2025 |
5.65 (-0.53%) |
6.00 |
5.43 - 6.00 |
1.7562 times |
Fri 10 October 2025 |
5.68 (4.99%) |
5.80 |
5.41 - 5.80 |
0.5747 times |
Thu 09 October 2025 |
5.41 (-4.75%) |
5.60 |
5.36 - 5.60 |
2.8429 times |
Wed 08 October 2025 |
5.68 (0%) |
5.79 |
5.68 - 5.79 |
0.5687 times |
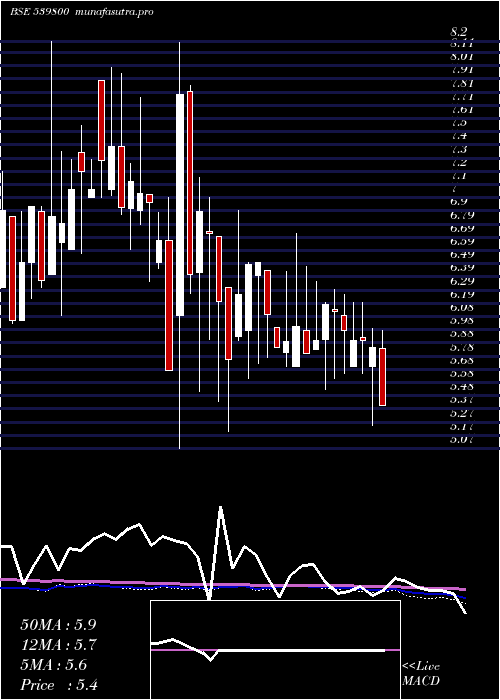
Weekly price and charts Chdchem Strong weekly Stock price targets for Chdchem 539800 are 5.58 and 6.15 | Weekly Target 1 | 5.14 | | Weekly Target 2 | 5.45 | | Weekly Target 3 | 5.7133333333333 | | Weekly Target 4 | 6.02 | | Weekly Target 5 | 6.28 |
Weekly price and volumes for Chdchem
| Date |
Closing |
Open |
Range |
Volume |
Thu 23 October 2025 |
5.75 (6.28%) |
5.41 |
5.41 - 5.98 |
0.4413 times |
Fri 17 October 2025 |
5.41 (-4.75%) |
6.00 |
5.07 - 6.00 |
0.8831 times |
Fri 10 October 2025 |
5.68 (-2.07%) |
5.26 |
5.26 - 6.00 |
1.9304 times |
Fri 03 October 2025 |
5.80 (2.65%) |
5.07 |
5.07 - 5.98 |
1.679 times |
Fri 26 September 2025 |
5.65 (0.71%) |
5.62 |
5.62 - 5.90 |
0.5193 times |
Fri 19 September 2025 |
5.61 (-4.59%) |
5.79 |
5.12 - 5.99 |
1.1646 times |
Fri 12 September 2025 |
5.88 (-0.34%) |
5.90 |
5.36 - 5.95 |
0.9465 times |
Fri 05 September 2025 |
5.90 (3.15%) |
5.66 |
4.81 - 6.38 |
0.9159 times |
Fri 29 August 2025 |
5.72 (-3.54%) |
5.91 |
5.18 - 5.99 |
0.9228 times |
Fri 22 August 2025 |
5.93 (0%) |
5.61 |
5.61 - 6.06 |
0.5971 times |
Thu 14 August 2025 |
5.93 (-2.15%) |
6.02 |
5.52 - 6.02 |
0.1824 times |
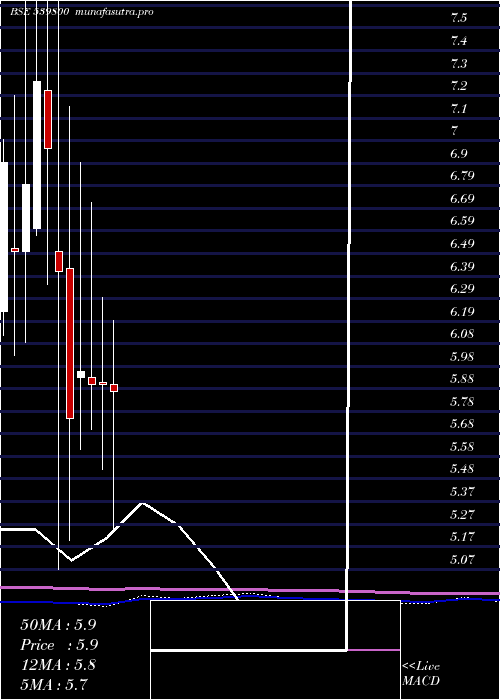
Monthly price and charts Chdchem Strong monthly Stock price targets for Chdchem 539800 are 5.41 and 6.34 | Monthly Target 1 | 4.68 | | Monthly Target 2 | 5.21 | | Monthly Target 3 | 5.6066666666667 | | Monthly Target 4 | 6.14 | | Monthly Target 5 | 6.54 |
Monthly price and volumes Chdchem
| Date |
Closing |
Open |
Range |
Volume |
Thu 23 October 2025 |
5.75 (4.55%) |
5.50 |
5.07 - 6.00 |
0.702 times |
Tue 30 September 2025 |
5.50 (-3.85%) |
5.66 |
4.81 - 6.38 |
0.7273 times |
Fri 29 August 2025 |
5.72 (-4.51%) |
5.90 |
5.18 - 6.06 |
0.3028 times |
Thu 31 July 2025 |
5.99 (1.53%) |
5.90 |
5.25 - 6.19 |
1.1946 times |
Mon 30 June 2025 |
5.90 (0%) |
5.91 |
5.52 - 6.29 |
0.4484 times |
Fri 30 May 2025 |
5.90 (-1.01%) |
5.93 |
5.70 - 6.72 |
1.452 times |
Wed 30 April 2025 |
5.96 (3.65%) |
5.93 |
5.61 - 6.90 |
0.8199 times |
Fri 28 March 2025 |
5.75 (-10.3%) |
6.42 |
5.20 - 7.15 |
1.1859 times |
Fri 28 February 2025 |
6.41 (-7.9%) |
6.50 |
5.07 - 8.19 |
2.3291 times |
Fri 31 January 2025 |
6.96 (-4.13%) |
7.22 |
6.35 - 8.00 |
0.838 times |
Tue 31 December 2024 |
7.26 (6.76%) |
6.60 |
6.57 - 7.90 |
1.7735 times |
DMA SMA EMA moving averages of Chdchem 539800
DMA (daily moving average) of Chdchem 539800
| DMA period | DMA value | | 5 day DMA | 5.55 | | 12 day DMA | 5.58 | | 20 day DMA | 5.6 | | 35 day DMA | 5.67 | | 50 day DMA | 5.71 | | 100 day DMA | 5.79 | | 150 day DMA | 5.89 | | 200 day DMA | 6.11 | EMA (exponential moving average) of Chdchem 539800
| EMA period | EMA current | EMA prev | EMA prev2 | | 5 day EMA | 5.6 | 5.53 | 5.55 | | 12 day EMA | 5.59 | 5.56 | 5.57 | | 20 day EMA | 5.61 | 5.6 | 5.61 | | 35 day EMA | 5.66 | 5.65 | 5.66 | | 50 day EMA | 5.72 | 5.72 | 5.73 |
SMA (simple moving average) of Chdchem 539800
| SMA period | SMA current | SMA prev | SMA prev2 | | 5 day SMA | 5.55 | 5.53 | 5.51 | | 12 day SMA | 5.58 | 5.55 | 5.57 | | 20 day SMA | 5.6 | 5.6 | 5.61 | | 35 day SMA | 5.67 | 5.66 | 5.67 | | 50 day SMA | 5.71 | 5.71 | 5.72 | | 100 day SMA | 5.79 | 5.79 | 5.8 | | 150 day SMA | 5.89 | 5.89 | 5.9 | | 200 day SMA | 6.11 | 6.11 | 6.12 |
|
|
