Gtv 539479 full analysis,charts,indicators,moving averages,SMA,DMA,EMA,ADX,MACD,RSIGtv 539479 WideScreen charts, DMA,SMA,EMA technical analysis, forecast prediction, by indicators ADX,MACD,RSI,CCI BSE stock exchange
Daily price and charts and targets Gtv Strong Daily Stock price targets for Gtv 539479 are 73.59 and 78.27 | Daily Target 1 | 72.57 | | Daily Target 2 | 74.61 | | Daily Target 3 | 77.246666666667 | | Daily Target 4 | 79.29 | | Daily Target 5 | 81.93 |
Daily price and volume Gtv
| Date |
Closing |
Open |
Range |
Volume |
Thu 23 October 2025 |
76.66 (-2.08%) |
79.88 |
75.20 - 79.88 |
0.2613 times |
Tue 21 October 2025 |
78.29 (5.36%) |
75.90 |
74.00 - 79.30 |
0.3323 times |
Mon 20 October 2025 |
74.31 (4.66%) |
71.90 |
70.29 - 75.00 |
4.1354 times |
Fri 17 October 2025 |
71.00 (-3.91%) |
73.14 |
70.60 - 75.90 |
0.7392 times |
Thu 16 October 2025 |
73.89 (-1%) |
73.89 |
72.10 - 75.70 |
1.0233 times |
Wed 15 October 2025 |
74.64 (-2.48%) |
78.49 |
71.00 - 79.00 |
1.2235 times |
Tue 14 October 2025 |
76.54 (2.99%) |
74.33 |
74.33 - 78.50 |
0.7917 times |
Mon 13 October 2025 |
74.32 (-2.36%) |
74.00 |
73.00 - 79.88 |
0.7101 times |
Fri 10 October 2025 |
76.12 (-1.97%) |
76.11 |
73.62 - 77.00 |
0.1839 times |
Thu 09 October 2025 |
77.65 (5.99%) |
75.00 |
73.01 - 78.00 |
0.5993 times |
Wed 08 October 2025 |
73.26 (7.15%) |
68.01 |
67.00 - 74.30 |
0.9334 times |
Weekly price and charts Gtv Strong weekly Stock price targets for Gtv 539479 are 73.48 and 83.07 | Weekly Target 1 | 66.02 | | Weekly Target 2 | 71.34 | | Weekly Target 3 | 75.61 | | Weekly Target 4 | 80.93 | | Weekly Target 5 | 85.2 |
Weekly price and volumes for Gtv
| Date |
Closing |
Open |
Range |
Volume |
Thu 23 October 2025 |
76.66 (7.97%) |
71.90 |
70.29 - 79.88 |
1.9938 times |
Fri 17 October 2025 |
71.00 (-6.73%) |
74.00 |
70.60 - 79.88 |
1.8921 times |
Fri 10 October 2025 |
76.12 (11.68%) |
69.49 |
67.00 - 78.00 |
0.9671 times |
Fri 03 October 2025 |
68.16 (1.04%) |
67.46 |
63.07 - 70.00 |
0.936 times |
Fri 26 September 2025 |
67.46 (-5.43%) |
71.33 |
64.05 - 72.90 |
0.644 times |
Fri 19 September 2025 |
71.33 (2.83%) |
69.39 |
67.00 - 72.05 |
0.8269 times |
Fri 12 September 2025 |
69.37 (-0.97%) |
73.00 |
67.21 - 77.22 |
0.4694 times |
Fri 05 September 2025 |
70.05 (-9.4%) |
73.46 |
64.43 - 81.00 |
1.0623 times |
Fri 29 August 2025 |
77.32 (-3.97%) |
82.13 |
77.32 - 82.13 |
0.1483 times |
Fri 22 August 2025 |
80.52 (10.35%) |
72.50 |
72.50 - 80.52 |
1.0602 times |
Thu 14 August 2025 |
72.97 (-7.74%) |
77.51 |
72.97 - 77.51 |
0.2532 times |
Monthly price and charts Gtv Strong monthly Stock price targets for Gtv 539479 are 69.87 and 86.68 | Monthly Target 1 | 56.39 | | Monthly Target 2 | 66.53 | | Monthly Target 3 | 73.203333333333 | | Monthly Target 4 | 83.34 | | Monthly Target 5 | 90.01 |
Monthly price and volumes Gtv
| Date |
Closing |
Open |
Range |
Volume |
Thu 23 October 2025 |
76.66 (18.85%) |
66.00 |
63.07 - 79.88 |
4.045 times |
Tue 30 September 2025 |
64.50 (-16.58%) |
73.46 |
63.95 - 81.00 |
2.7357 times |
Fri 29 August 2025 |
77.32 (-13.37%) |
87.47 |
72.50 - 87.47 |
1.1719 times |
Thu 31 July 2025 |
89.25 (-91.96%) |
1158.00 |
89.25 - 1443.30 |
0.4688 times |
Mon 30 June 2025 |
1109.95 (18.7%) |
985.00 |
956.10 - 1199.00 |
0.386 times |
Fri 30 May 2025 |
935.05 (26.79%) |
744.00 |
685.00 - 939.00 |
0.6232 times |
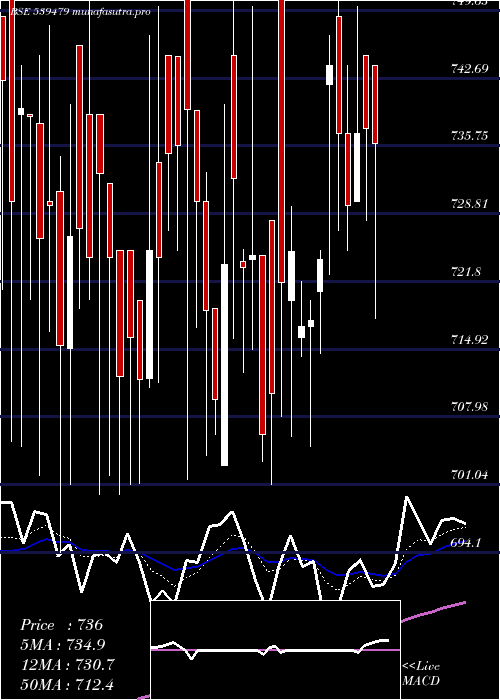
Wed 30 April 2025 |
737.50 (3.91%) |
703.00 |
701.00 - 765.00 |
0.054 times |
Fri 28 March 2025 |
709.75 (-2.27%) |
730.00 |
694.10 - 771.00 |
0.2021 times |
Fri 28 February 2025 |
726.20 (-2.09%) |
774.30 |
695.00 - 775.00 |
0.0682 times |
Fri 31 January 2025 |
741.70 (42.17%) |
565.00 |
510.10 - 763.90 |
0.2451 times |
Tue 31 December 2024 |
521.70 (4.01%) |
523.95 |
481.50 - 583.65 |
0.152 times |
DMA SMA EMA moving averages of Gtv 539479
DMA (daily moving average) of Gtv 539479
| DMA period | DMA value | | 5 day DMA | 74.83 | | 12 day DMA | 74.59 | | 20 day DMA | 71.57 | | 35 day DMA | 70.86 | | 50 day DMA | 72.67 | | 100 day DMA | 499.79 | | 150 day DMA | 582.84 | | 200 day DMA | 604.72 | EMA (exponential moving average) of Gtv 539479
| EMA period | EMA current | EMA prev | EMA prev2 | | 5 day EMA | 75.68 | 75.19 | 73.64 | | 12 day EMA | 74.2 | 73.75 | 72.92 | | 20 day EMA | 73.23 | 72.87 | 72.3 | | 35 day EMA | 73.35 | 73.16 | 72.86 | | 50 day EMA | 73.7 | 73.58 | 73.39 |
SMA (simple moving average) of Gtv 539479
| SMA period | SMA current | SMA prev | SMA prev2 | | 5 day SMA | 74.83 | 74.43 | 74.08 | | 12 day SMA | 74.59 | 74.06 | 73.21 | | 20 day SMA | 71.57 | 71.09 | 70.65 | | 35 day SMA | 70.86 | 70.71 | 70.62 | | 50 day SMA | 72.67 | 72.72 | 72.77 | | 100 day SMA | 499.79 | 507.93 | 515.88 | | 150 day SMA | 582.84 | 587.18 | 591.5 | | 200 day SMA | 604.72 | 606.96 | 609.18 |
|
|
