Indigo 539448 full analysis,charts,indicators,moving averages,SMA,DMA,EMA,ADX,MACD,RSIIndigo 539448 WideScreen charts, DMA,SMA,EMA technical analysis, forecast prediction, by indicators ADX,MACD,RSI,CCI BSE stock exchange
Daily price and charts and targets Indigo Strong Daily Stock price targets for Indigo 539448 are 5694.9 and 5865.05 | Daily Target 1 | 5664.83 | | Daily Target 2 | 5724.97 | | Daily Target 3 | 5834.9833333333 | | Daily Target 4 | 5895.12 | | Daily Target 5 | 6005.13 |
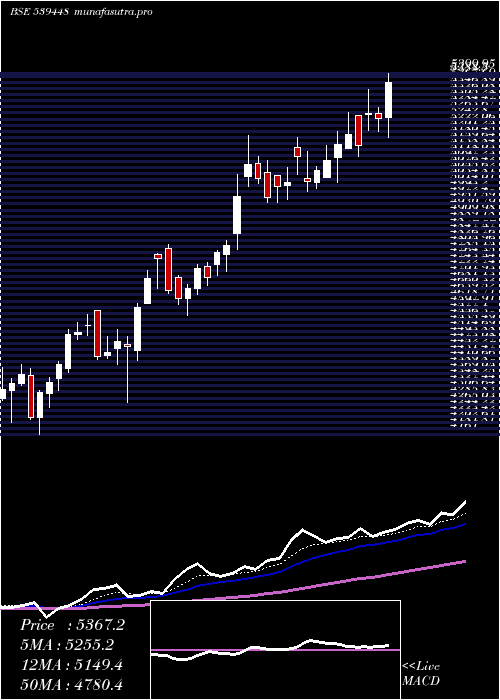
Daily price and volume Indigo
| Date |
Closing |
Open |
Range |
Volume |
Thu 23 October 2025 |
5785.10 (-2.15%) |
5913.00 |
5774.85 - 5945.00 |
1.4248 times |
Tue 21 October 2025 |
5912.50 (-0.35%) |
5935.05 |
5905.40 - 5953.25 |
0.2848 times |
Mon 20 October 2025 |
5933.40 (1.45%) |
5862.75 |
5862.75 - 5940.00 |
1.6094 times |
Fri 17 October 2025 |
5848.40 (-0.5%) |
5896.30 |
5839.00 - 5931.00 |
0.6658 times |
Thu 16 October 2025 |
5878.05 (0.35%) |
5857.90 |
5857.75 - 5923.00 |
1.3497 times |
Wed 15 October 2025 |
5857.75 (1.76%) |
5781.00 |
5781.00 - 5870.00 |
0.9971 times |
Tue 14 October 2025 |
5756.30 (-0.54%) |
5752.15 |
5742.00 - 5797.00 |
0.6056 times |
Mon 13 October 2025 |
5787.45 (0.92%) |
5750.00 |
5736.00 - 5822.60 |
1.536 times |
Fri 10 October 2025 |
5734.55 (0.21%) |
5722.50 |
5712.00 - 5768.50 |
0.4712 times |
Thu 09 October 2025 |
5722.65 (1.63%) |
5635.05 |
5625.95 - 5744.45 |
1.0557 times |
Wed 08 October 2025 |
5630.60 (-0.57%) |
5653.10 |
5623.35 - 5680.15 |
0.4356 times |
Weekly price and charts Indigo Strong weekly Stock price targets for Indigo 539448 are 5690.78 and 5869.18 | Weekly Target 1 | 5659.33 | | Weekly Target 2 | 5722.22 | | Weekly Target 3 | 5837.7333333333 | | Weekly Target 4 | 5900.62 | | Weekly Target 5 | 6016.13 |
Weekly price and volumes for Indigo
| Date |
Closing |
Open |
Range |
Volume |
Thu 23 October 2025 |
5785.10 (-1.08%) |
5862.75 |
5774.85 - 5953.25 |
0.1026 times |
Fri 17 October 2025 |
5848.40 (1.99%) |
5750.00 |
5736.00 - 5931.00 |
0.1593 times |
Fri 10 October 2025 |
5734.55 (1.37%) |
5620.95 |
5605.55 - 5768.50 |
0.2053 times |
Fri 03 October 2025 |
5657.20 (1.79%) |
5594.85 |
5502.40 - 5785.00 |
0.4161 times |
Fri 26 September 2025 |
5557.65 (-2.17%) |
5727.00 |
5535.35 - 5814.35 |
0.1829 times |
Fri 19 September 2025 |
5680.95 (-0.78%) |
5769.00 |
5646.50 - 5769.00 |
0.1704 times |
Fri 12 September 2025 |
5725.40 (1.01%) |
5669.15 |
5545.00 - 5778.35 |
0.2869 times |
Fri 05 September 2025 |
5668.40 (0.71%) |
5628.60 |
5582.20 - 5795.40 |
0.5952 times |
Fri 29 August 2025 |
5628.60 (-7.49%) |
6168.95 |
5611.40 - 6168.95 |
7.5615 times |
Fri 22 August 2025 |
6084.45 (1.36%) |
6046.95 |
6010.00 - 6225.05 |
0.3195 times |
Thu 14 August 2025 |
6002.90 (4.07%) |
5776.95 |
5729.25 - 6055.00 |
0.1965 times |

Monthly price and charts Indigo Strong monthly Stock price targets for Indigo 539448 are 5656.48 and 6081.88 | Monthly Target 1 | 5330 | | Monthly Target 2 | 5557.55 | | Monthly Target 3 | 5755.4 | | Monthly Target 4 | 5982.95 | | Monthly Target 5 | 6180.8 |
Monthly price and volumes Indigo
| Date |
Closing |
Open |
Range |
Volume |
Thu 23 October 2025 |
5785.10 (3.41%) |
5584.95 |
5527.85 - 5953.25 |
0.225 times |
Tue 30 September 2025 |
5594.30 (-0.61%) |
5628.60 |
5502.40 - 5814.35 |
0.5846 times |
Fri 29 August 2025 |
5628.60 (-4.75%) |
5899.25 |
5611.40 - 6225.05 |
3.1887 times |
Thu 31 July 2025 |
5909.30 (-1.13%) |
5975.95 |
5610.50 - 6019.20 |
1.1309 times |
Mon 30 June 2025 |
5976.70 (12.06%) |
5335.00 |
5175.00 - 5997.25 |
1.0281 times |
Fri 30 May 2025 |
5333.45 (1.71%) |
5144.60 |
4890.90 - 5665.65 |
1.6848 times |
Wed 30 April 2025 |
5243.55 (2.55%) |
5040.10 |
4994.20 - 5646.90 |
0.5811 times |
Fri 28 March 2025 |
5113.00 (14.12%) |
4470.90 |
4272.00 - 5187.00 |
0.4742 times |
Fri 28 February 2025 |
4480.30 (3.58%) |
4489.75 |
4161.00 - 4585.80 |
0.5293 times |
Fri 31 January 2025 |
4325.35 (-5%) |
4639.95 |
3946.40 - 4639.95 |
0.5733 times |
Tue 31 December 2024 |
4552.95 (4.14%) |
4355.05 |
4275.00 - 4736.65 |
0.2905 times |
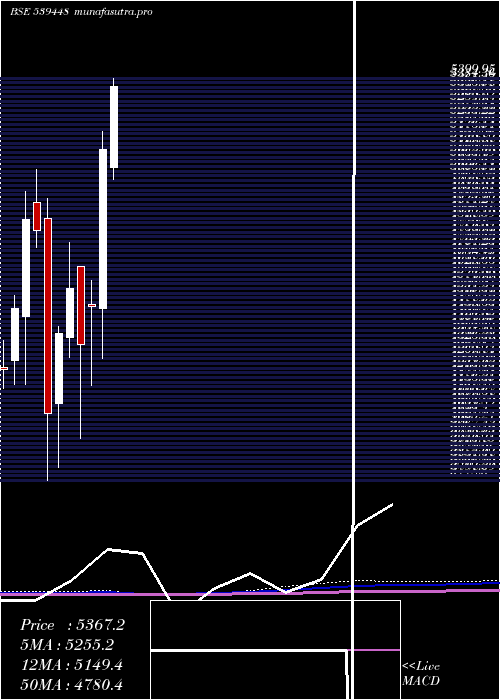
DMA SMA EMA moving averages of Indigo 539448
DMA (daily moving average) of Indigo 539448
| DMA period | DMA value | | 5 day DMA | 5871.49 | | 12 day DMA | 5792.49 | | 20 day DMA | 5733.49 | | 35 day DMA | 5719.75 | | 50 day DMA | 5786.07 | | 100 day DMA | 5742.8 | | 150 day DMA | 5566.34 | | 200 day DMA | 5261.8 | EMA (exponential moving average) of Indigo 539448
| EMA period | EMA current | EMA prev | EMA prev2 | | 5 day EMA | 5846.6 | 5877.35 | 5859.78 | | 12 day EMA | 5807.09 | 5811.09 | 5792.66 | | 20 day EMA | 5779.64 | 5779.07 | 5765.03 | | 35 day EMA | 5781.21 | 5780.98 | 5773.24 | | 50 day EMA | 5796.62 | 5797.09 | 5792.38 |
SMA (simple moving average) of Indigo 539448
| SMA period | SMA current | SMA prev | SMA prev2 | | 5 day SMA | 5871.49 | 5886.02 | 5854.78 | | 12 day SMA | 5792.49 | 5785.27 | 5763.99 | | 20 day SMA | 5733.49 | 5730.93 | 5722.59 | | 35 day SMA | 5719.75 | 5716.32 | 5709.39 | | 50 day SMA | 5786.07 | 5785.73 | 5784.43 | | 100 day SMA | 5742.8 | 5738.17 | 5732.29 | | 150 day SMA | 5566.34 | 5559.53 | 5551.41 | | 200 day SMA | 5261.8 | 5255.91 | 5248.55 |
|
|
