Coffeeday 539436 full analysis,charts,indicators,moving averages,SMA,DMA,EMA,ADX,MACD,RSICoffeeday 539436 WideScreen charts, DMA,SMA,EMA technical analysis, forecast prediction, by indicators ADX,MACD,RSI,CCI BSE stock exchange
Daily price and charts and targets Coffeeday Strong Daily Stock price targets for Coffeeday 539436 are 41.7 and 43.9 | Daily Target 1 | 41.23 | | Daily Target 2 | 42.16 | | Daily Target 3 | 43.43 | | Daily Target 4 | 44.36 | | Daily Target 5 | 45.63 |
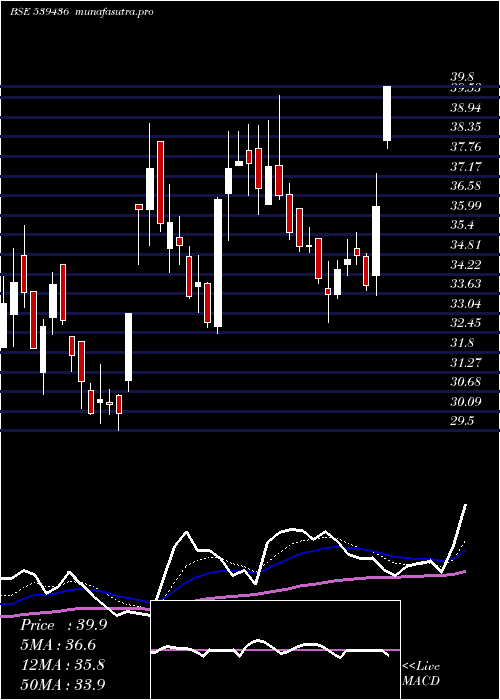
Daily price and volume Coffeeday
| Date |
Closing |
Open |
Range |
Volume |
Tue 21 October 2025 |
43.09 (-0.16%) |
43.16 |
42.50 - 44.70 |
0.2283 times |
Mon 20 October 2025 |
43.16 (2.49%) |
42.70 |
41.75 - 43.80 |
0.7634 times |
Fri 17 October 2025 |
42.11 (-0.64%) |
41.89 |
41.00 - 42.98 |
0.4788 times |
Thu 16 October 2025 |
42.38 (-0.54%) |
42.60 |
41.90 - 43.48 |
0.3858 times |
Wed 15 October 2025 |
42.61 (1.24%) |
42.09 |
41.56 - 43.00 |
0.311 times |
Tue 14 October 2025 |
42.09 (-1.87%) |
42.89 |
41.26 - 43.70 |
0.6478 times |
Mon 13 October 2025 |
42.89 (-1.92%) |
43.99 |
42.10 - 44.00 |
0.5816 times |
Fri 10 October 2025 |
43.73 (2.15%) |
42.40 |
41.81 - 44.75 |
3.0652 times |
Thu 09 October 2025 |
42.81 (4.98%) |
40.50 |
39.50 - 42.81 |
2.8964 times |
Wed 08 October 2025 |
40.78 (-1.83%) |
40.70 |
40.56 - 41.99 |
0.6417 times |
Tue 07 October 2025 |
41.54 (0.14%) |
41.76 |
40.40 - 41.88 |
0.613 times |
Weekly price and charts Coffeeday Strong weekly Stock price targets for Coffeeday 539436 are 42.42 and 45.37 | Weekly Target 1 | 40.23 | | Weekly Target 2 | 41.66 | | Weekly Target 3 | 43.18 | | Weekly Target 4 | 44.61 | | Weekly Target 5 | 46.13 |
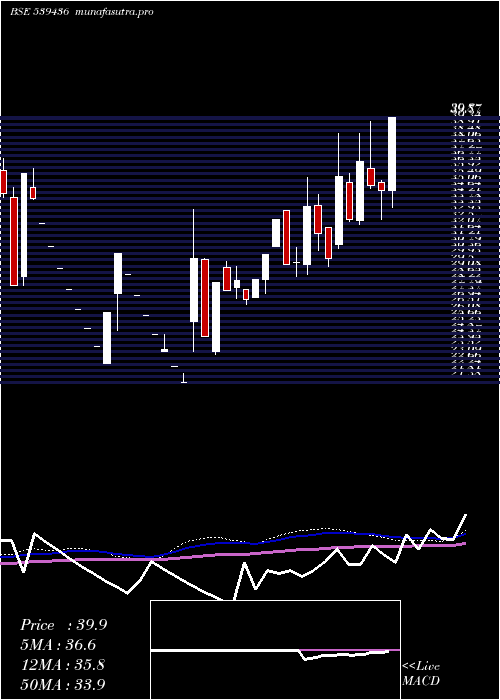
Weekly price and volumes for Coffeeday
| Date |
Closing |
Open |
Range |
Volume |
Tue 21 October 2025 |
43.09 (2.33%) |
42.70 |
41.75 - 44.70 |
0.0409 times |
Fri 17 October 2025 |
42.11 (-3.7%) |
43.99 |
41.00 - 44.00 |
0.0991 times |
Fri 10 October 2025 |
43.73 (6.14%) |
41.20 |
39.50 - 44.75 |
0.3228 times |
Fri 03 October 2025 |
41.20 (2.67%) |
40.00 |
38.70 - 42.38 |
0.1295 times |
Fri 26 September 2025 |
40.13 (-9.25%) |
44.77 |
40.09 - 46.00 |
0.2609 times |
Fri 19 September 2025 |
44.22 (-1.34%) |
44.42 |
43.00 - 46.67 |
0.2594 times |
Fri 12 September 2025 |
44.82 (0.56%) |
44.59 |
44.12 - 50.70 |
1.1588 times |
Fri 05 September 2025 |
44.57 (-10.98%) |
51.11 |
44.20 - 51.49 |
2.347 times |
Fri 29 August 2025 |
50.07 (13%) |
44.73 |
41.04 - 50.94 |
2.038 times |
Fri 22 August 2025 |
44.31 (17.04%) |
40.00 |
37.53 - 47.37 |
3.3437 times |
Thu 14 August 2025 |
37.86 (4.9%) |
35.80 |
35.42 - 38.99 |
0.6674 times |
Monthly price and charts Coffeeday Strong monthly Stock price targets for Coffeeday 539436 are 41.3 and 46.55 | Monthly Target 1 | 37.2 | | Monthly Target 2 | 40.14 | | Monthly Target 3 | 42.446666666667 | | Monthly Target 4 | 45.39 | | Monthly Target 5 | 47.7 |
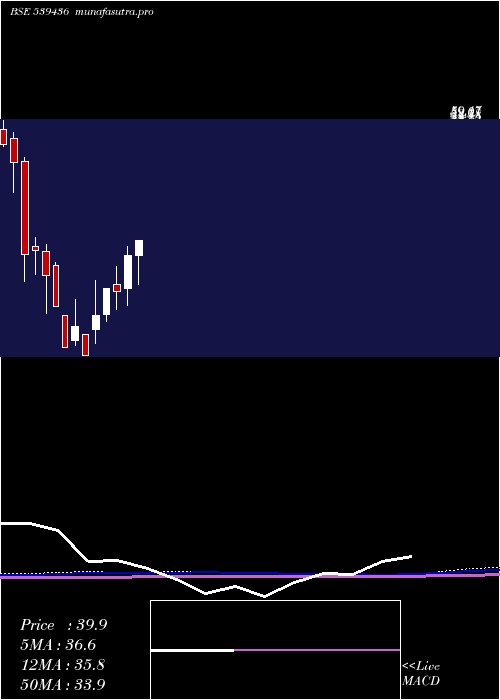
Monthly price and volumes Coffeeday
| Date |
Closing |
Open |
Range |
Volume |
Tue 21 October 2025 |
43.09 (2.69%) |
41.49 |
39.50 - 44.75 |
0.1886 times |
Tue 30 September 2025 |
41.96 (-16.2%) |
51.11 |
38.70 - 51.49 |
1.4999 times |
Fri 29 August 2025 |
50.07 (39.67%) |
36.65 |
34.24 - 50.94 |
2.4889 times |
Thu 31 July 2025 |
35.85 (-4.3%) |
37.48 |
32.75 - 42.45 |
1.7832 times |
Mon 30 June 2025 |
37.46 (17.91%) |
32.18 |
29.50 - 38.85 |
0.7959 times |
Fri 30 May 2025 |
31.77 (-1.06%) |
32.75 |
28.77 - 35.67 |
0.664 times |
Wed 30 April 2025 |
32.11 (15.55%) |
28.00 |
26.85 - 32.11 |
0.2923 times |
Fri 28 March 2025 |
27.79 (29.98%) |
25.65 |
23.37 - 33.45 |
1.562 times |
Mon 24 February 2025 |
21.38 (-17.99%) |
24.77 |
21.38 - 24.77 |
0.1612 times |
Mon 27 January 2025 |
26.07 (14.8%) |
23.84 |
23.00 - 30.40 |
0.5642 times |
Mon 30 December 2024 |
22.71 (-22.54%) |
27.86 |
22.71 - 27.86 |
0.0161 times |
DMA SMA EMA moving averages of Coffeeday 539436
DMA (daily moving average) of Coffeeday 539436
| DMA period | DMA value | | 5 day DMA | 42.67 | | 12 day DMA | 42.39 | | 20 day DMA | 42.28 | | 35 day DMA | 43.68 | | 50 day DMA | 42.93 | | 100 day DMA | 39.09 | | 150 day DMA | 35.88 | | 200 day DMA | 34.64 | EMA (exponential moving average) of Coffeeday 539436
| EMA period | EMA current | EMA prev | EMA prev2 | | 5 day EMA | 42.77 | 42.61 | 42.34 | | 12 day EMA | 42.57 | 42.48 | 42.36 | | 20 day EMA | 42.59 | 42.54 | 42.48 | | 35 day EMA | 42.29 | 42.24 | 42.19 | | 50 day EMA | 42.28 | 42.25 | 42.21 |
SMA (simple moving average) of Coffeeday 539436
| SMA period | SMA current | SMA prev | SMA prev2 | | 5 day SMA | 42.67 | 42.47 | 42.42 | | 12 day SMA | 42.39 | 42.23 | 42.09 | | 20 day SMA | 42.28 | 42.26 | 42.31 | | 35 day SMA | 43.68 | 43.8 | 44 | | 50 day SMA | 42.93 | 42.78 | 42.61 | | 100 day SMA | 39.09 | 39 | 38.89 | | 150 day SMA | 35.88 | 35.82 | 35.74 | | 200 day SMA | 34.64 | 34.62 | 34.6 |
|
|
