Sadbhin 539346 full analysis,charts,indicators,moving averages,SMA,DMA,EMA,ADX,MACD,RSISadbhin 539346 WideScreen charts, DMA,SMA,EMA technical analysis, forecast prediction, by indicators ADX,MACD,RSI,CCI BSE stock exchange
Daily price and charts and targets Sadbhin Strong Daily Stock price targets for Sadbhin 539346 are 3.65 and 3.84 | Daily Target 1 | 3.49 | | Daily Target 2 | 3.62 | | Daily Target 3 | 3.6833333333333 | | Daily Target 4 | 3.81 | | Daily Target 5 | 3.87 |
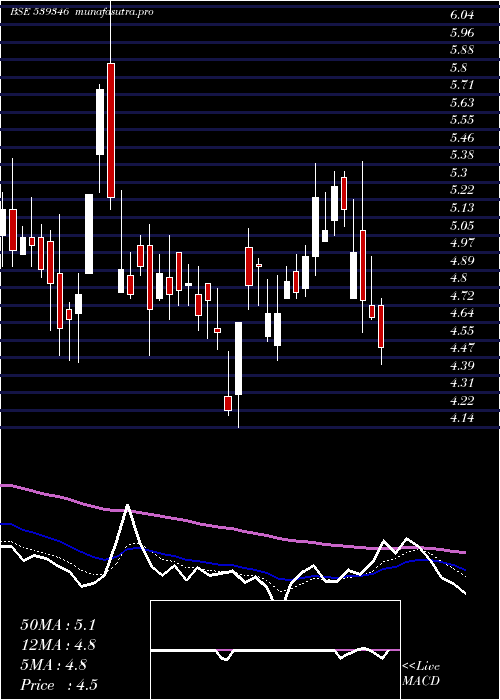
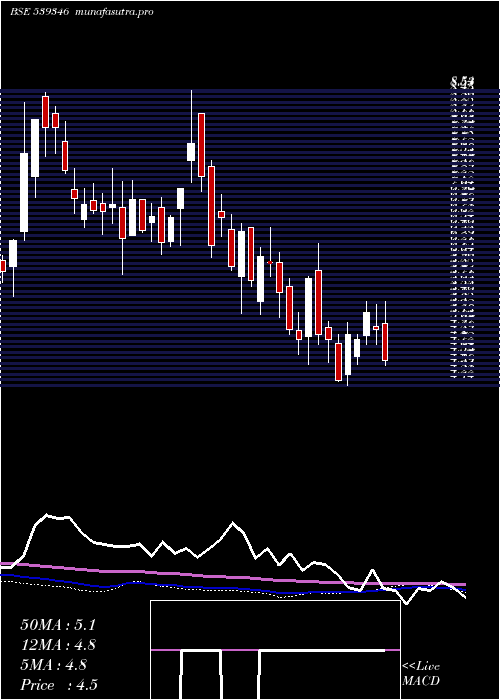
Daily price and volume Sadbhin
| Date |
Closing |
Open |
Range |
Volume |
Fri 05 December 2025 |
3.74 (1.91%) |
3.68 |
3.56 - 3.75 |
0.6093 times |
Thu 04 December 2025 |
3.67 (-2.39%) |
3.76 |
3.63 - 3.76 |
0.3476 times |
Wed 03 December 2025 |
3.76 (0.27%) |
3.82 |
3.63 - 3.85 |
0.915 times |
Tue 02 December 2025 |
3.75 (-4.82%) |
3.96 |
3.75 - 3.96 |
1.7978 times |
Mon 01 December 2025 |
3.94 (2.87%) |
4.02 |
3.83 - 4.02 |
3.4089 times |
Fri 28 November 2025 |
3.83 (4.93%) |
3.68 |
3.68 - 3.83 |
0.4666 times |
Thu 27 November 2025 |
3.65 (4.89%) |
3.51 |
3.45 - 3.65 |
0.5665 times |
Wed 26 November 2025 |
3.48 (-4.13%) |
3.64 |
3.48 - 3.65 |
1.5285 times |
Tue 25 November 2025 |
3.63 (-0.55%) |
3.65 |
3.56 - 3.65 |
0.1359 times |
Mon 24 November 2025 |
3.65 (0.27%) |
3.68 |
3.60 - 3.69 |
0.2238 times |
Fri 21 November 2025 |
3.64 (-0.55%) |
3.66 |
3.58 - 3.69 |
0.7556 times |
Weekly price and charts Sadbhin Strong weekly Stock price targets for Sadbhin 539346 are 3.42 and 3.88 | Weekly Target 1 | 3.31 | | Weekly Target 2 | 3.53 | | Weekly Target 3 | 3.7733333333333 | | Weekly Target 4 | 3.99 | | Weekly Target 5 | 4.23 |
Weekly price and volumes for Sadbhin
| Date |
Closing |
Open |
Range |
Volume |
Fri 05 December 2025 |
3.74 (-2.35%) |
4.02 |
3.56 - 4.02 |
1.6663 times |
Fri 28 November 2025 |
3.83 (5.22%) |
3.68 |
3.45 - 3.83 |
0.6877 times |
Fri 21 November 2025 |
3.64 (-2.93%) |
3.75 |
3.58 - 3.92 |
0.598 times |
Fri 14 November 2025 |
3.75 (-0.79%) |
3.78 |
3.66 - 3.95 |
0.8802 times |
Fri 07 November 2025 |
3.78 (-1.56%) |
3.82 |
3.68 - 3.98 |
1.0904 times |
Fri 31 October 2025 |
3.84 (0%) |
3.75 |
3.60 - 3.89 |
0.9189 times |
Thu 23 October 2025 |
3.84 (2.95%) |
3.76 |
3.65 - 3.99 |
0.5024 times |
Fri 17 October 2025 |
3.73 (-1.06%) |
3.83 |
3.63 - 3.94 |
0.7052 times |
Fri 10 October 2025 |
3.77 (-4.56%) |
3.98 |
3.52 - 3.98 |
2.606 times |
Fri 03 October 2025 |
3.95 (-0.5%) |
4.01 |
3.79 - 4.01 |
0.3449 times |
Fri 26 September 2025 |
3.97 (-1%) |
4.01 |
3.77 - 4.04 |
3.8 times |
Monthly price and charts Sadbhin Strong monthly Stock price targets for Sadbhin 539346 are 3.42 and 3.88 | Monthly Target 1 | 3.31 | | Monthly Target 2 | 3.53 | | Monthly Target 3 | 3.7733333333333 | | Monthly Target 4 | 3.99 | | Monthly Target 5 | 4.23 |
Monthly price and volumes Sadbhin
| Date |
Closing |
Open |
Range |
Volume |
Fri 05 December 2025 |
3.74 (-2.35%) |
4.02 |
3.56 - 4.02 |
0.1568 times |
Fri 28 November 2025 |
3.83 (-0.26%) |
3.82 |
3.45 - 3.98 |
0.3064 times |
Fri 31 October 2025 |
3.84 (-2.54%) |
3.94 |
3.52 - 3.99 |
0.4607 times |
Tue 30 September 2025 |
3.94 (-3.9%) |
4.15 |
3.77 - 4.62 |
1.3493 times |
Fri 29 August 2025 |
4.10 (-0.49%) |
4.15 |
3.22 - 4.99 |
1.8639 times |
Thu 31 July 2025 |
4.12 (-21.67%) |
5.29 |
4.07 - 5.34 |
0.5841 times |
Mon 30 June 2025 |
5.26 (15.86%) |
4.49 |
4.29 - 5.70 |
1.6553 times |
Fri 30 May 2025 |
4.54 (0.44%) |
4.53 |
3.88 - 5.25 |
1.2661 times |
Wed 30 April 2025 |
4.52 (7.11%) |
4.30 |
4.14 - 5.40 |
0.7892 times |
Fri 28 March 2025 |
4.22 (-12.45%) |
4.87 |
4.20 - 6.25 |
1.5682 times |
Fri 28 February 2025 |
4.82 (-20.59%) |
5.98 |
4.60 - 6.49 |
0.9356 times |

DMA SMA EMA moving averages of Sadbhin 539346
DMA (daily moving average) of Sadbhin 539346
| DMA period | DMA value | | 5 day DMA | 3.77 | | 12 day DMA | 3.7 | | 20 day DMA | 3.74 | | 35 day DMA | 3.77 | | 50 day DMA | 3.8 | | 100 day DMA | 4.04 | | 150 day DMA | 4.3 | | 200 day DMA | 4.5 | EMA (exponential moving average) of Sadbhin 539346
| EMA period | EMA current | EMA prev | EMA prev2 | | 5 day EMA | 3.73 | 3.73 | 3.76 | | 12 day EMA | 3.73 | 3.73 | 3.74 | | 20 day EMA | 3.74 | 3.74 | 3.75 | | 35 day EMA | 3.78 | 3.78 | 3.79 | | 50 day EMA | 3.83 | 3.83 | 3.84 |
SMA (simple moving average) of Sadbhin 539346
| SMA period | SMA current | SMA prev | SMA prev2 | | 5 day SMA | 3.77 | 3.79 | 3.79 | | 12 day SMA | 3.7 | 3.71 | 3.72 | | 20 day SMA | 3.74 | 3.74 | 3.75 | | 35 day SMA | 3.77 | 3.77 | 3.77 | | 50 day SMA | 3.8 | 3.81 | 3.81 | | 100 day SMA | 4.04 | 4.05 | 4.06 | | 150 day SMA | 4.3 | 4.31 | 4.32 | | 200 day SMA | 4.5 | 4.51 | 4.52 |
|
|
