Mjco 539289 full analysis,charts,indicators,moving averages,SMA,DMA,EMA,ADX,MACD,RSIMjco 539289 WideScreen charts, DMA,SMA,EMA technical analysis, forecast prediction, by indicators ADX,MACD,RSI,CCI BSE stock exchange
Daily price and charts and targets Mjco Strong Daily Stock price targets for Mjco 539289 are 172 and 178.65 | Daily Target 1 | 170.62 | | Daily Target 2 | 173.38 | | Daily Target 3 | 177.26666666667 | | Daily Target 4 | 180.03 | | Daily Target 5 | 183.92 |
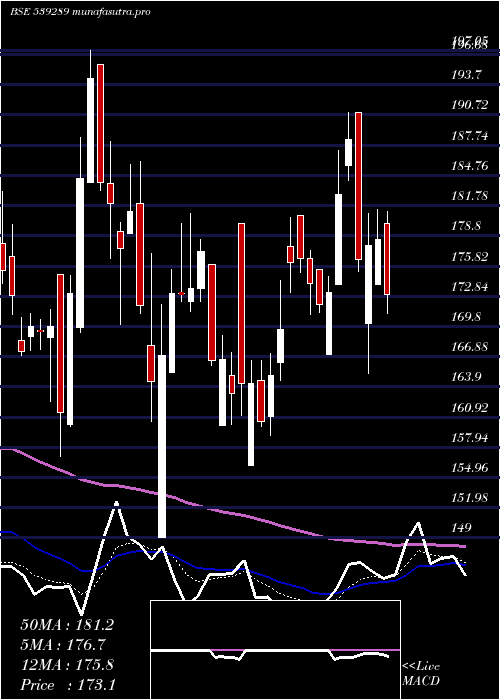
Daily price and volume Mjco
| Date |
Closing |
Open |
Range |
Volume |
Thu 23 October 2025 |
176.15 (-2.76%) |
181.15 |
174.50 - 181.15 |
1.1748 times |
Tue 21 October 2025 |
181.15 (-0.03%) |
180.70 |
176.85 - 183.40 |
0.1756 times |
Mon 20 October 2025 |
181.20 (0.78%) |
176.60 |
175.40 - 182.95 |
0.6371 times |
Fri 17 October 2025 |
179.80 (0.98%) |
180.55 |
175.50 - 183.40 |
2.3886 times |
Thu 16 October 2025 |
178.05 (7.55%) |
162.60 |
162.60 - 180.35 |
2.7488 times |
Wed 15 October 2025 |
165.55 (0.18%) |
167.70 |
162.10 - 167.70 |
0.3254 times |
Tue 14 October 2025 |
165.25 (-1.49%) |
166.60 |
164.40 - 168.05 |
0.2675 times |
Mon 13 October 2025 |
167.75 (0.3%) |
164.00 |
164.00 - 169.25 |
0.3068 times |
Fri 10 October 2025 |
167.25 (1.03%) |
165.00 |
165.00 - 168.00 |
1.1702 times |
Thu 09 October 2025 |
165.55 (-0.3%) |
166.40 |
163.35 - 167.40 |
0.8051 times |
Wed 08 October 2025 |
166.05 (-1.92%) |
169.30 |
165.00 - 170.75 |
0.7481 times |
Weekly price and charts Mjco Strong weekly Stock price targets for Mjco 539289 are 170.88 and 179.78 | Weekly Target 1 | 169.12 | | Weekly Target 2 | 172.63 | | Weekly Target 3 | 178.01666666667 | | Weekly Target 4 | 181.53 | | Weekly Target 5 | 186.92 |
Weekly price and volumes for Mjco
| Date |
Closing |
Open |
Range |
Volume |
Thu 23 October 2025 |
176.15 (-2.03%) |
176.60 |
174.50 - 183.40 |
0.0961 times |
Fri 17 October 2025 |
179.80 (7.5%) |
164.00 |
162.10 - 183.40 |
0.292 times |
Fri 10 October 2025 |
167.25 (-0.56%) |
166.00 |
163.35 - 180.50 |
0.2213 times |
Fri 03 October 2025 |
168.20 (-1.87%) |
176.00 |
167.35 - 186.20 |
1.2636 times |
Fri 26 September 2025 |
171.40 (1.84%) |
168.95 |
160.00 - 184.25 |
7.3556 times |
Fri 19 September 2025 |
168.30 (-1.67%) |
172.45 |
167.40 - 177.00 |
0.1194 times |
Fri 12 September 2025 |
171.15 (-2.95%) |
176.55 |
170.65 - 183.60 |
0.1238 times |
Fri 05 September 2025 |
176.35 (6.81%) |
168.00 |
161.35 - 191.70 |
0.4106 times |
Fri 29 August 2025 |
165.10 (-6.7%) |
178.00 |
164.80 - 178.70 |
0.0459 times |
Fri 22 August 2025 |
176.95 (1.2%) |
177.70 |
175.45 - 190.70 |
0.0717 times |
Thu 14 August 2025 |
174.85 (-4.11%) |
185.00 |
174.40 - 185.00 |
0.0827 times |
Monthly price and charts Mjco Strong monthly Stock price targets for Mjco 539289 are 169.13 and 190.43 | Monthly Target 1 | 152.58 | | Monthly Target 2 | 164.37 | | Monthly Target 3 | 173.88333333333 | | Monthly Target 4 | 185.67 | | Monthly Target 5 | 195.18 |
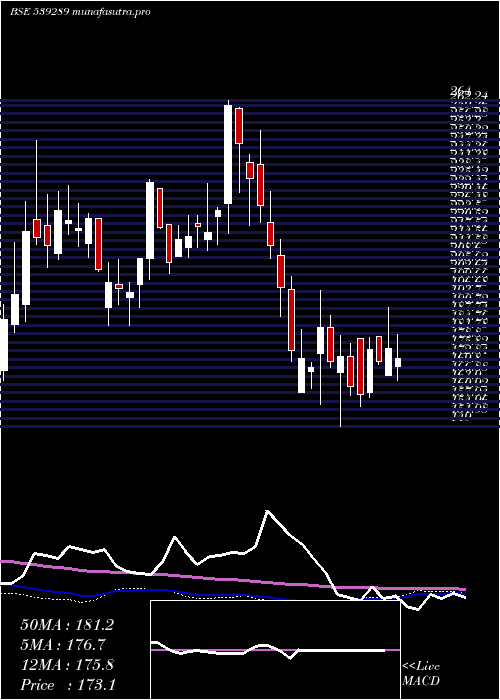
Monthly price and volumes Mjco
| Date |
Closing |
Open |
Range |
Volume |
Thu 23 October 2025 |
176.15 (2.53%) |
170.00 |
162.10 - 183.40 |
0.5585 times |
Tue 30 September 2025 |
171.80 (4.06%) |
168.00 |
160.00 - 191.70 |
5.8265 times |
Fri 29 August 2025 |
165.10 (-15.79%) |
193.70 |
164.80 - 197.65 |
0.3054 times |
Thu 31 July 2025 |
196.05 (-1.58%) |
197.95 |
185.80 - 226.80 |
0.8646 times |
Mon 30 June 2025 |
199.20 (0.05%) |
202.50 |
190.05 - 220.65 |
0.551 times |
Fri 30 May 2025 |
199.10 (15.05%) |
174.40 |
160.80 - 212.80 |
0.4157 times |
Wed 30 April 2025 |
173.05 (6%) |
180.00 |
156.10 - 191.00 |
0.1129 times |
Fri 28 March 2025 |
163.25 (-3.91%) |
175.00 |
149.00 - 197.05 |
0.2246 times |
Fri 28 February 2025 |
169.90 (-20.18%) |
209.40 |
161.15 - 215.00 |
0.2819 times |
Fri 31 January 2025 |
212.85 (-10.51%) |
235.00 |
208.25 - 264.00 |
0.8589 times |
Tue 31 December 2024 |
237.85 (10.58%) |
212.20 |
208.75 - 241.00 |
0.306 times |

DMA SMA EMA moving averages of Mjco 539289
DMA (daily moving average) of Mjco 539289
| DMA period | DMA value | | 5 day DMA | 179.27 | | 12 day DMA | 171.92 | | 20 day DMA | 170.78 | | 35 day DMA | 171.53 | | 50 day DMA | 172.47 | | 100 day DMA | 184.95 | | 150 day DMA | 182.5 | | 200 day DMA | 189.69 | EMA (exponential moving average) of Mjco 539289
| EMA period | EMA current | EMA prev | EMA prev2 | | 5 day EMA | 177.21 | 177.74 | 176.03 | | 12 day EMA | 174.12 | 173.75 | 172.4 | | 20 day EMA | 172.81 | 172.46 | 171.55 | | 35 day EMA | 172.99 | 172.8 | 172.31 | | 50 day EMA | 174.15 | 174.07 | 173.78 |
SMA (simple moving average) of Mjco 539289
| SMA period | SMA current | SMA prev | SMA prev2 | | 5 day SMA | 179.27 | 177.15 | 173.97 | | 12 day SMA | 171.92 | 171.59 | 170.51 | | 20 day SMA | 170.78 | 170.28 | 169.67 | | 35 day SMA | 171.53 | 171.59 | 171.19 | | 50 day SMA | 172.47 | 172.6 | 172.64 | | 100 day SMA | 184.95 | 185.18 | 185.35 | | 150 day SMA | 182.5 | 182.62 | 182.64 | | 200 day SMA | 189.69 | 189.89 | 190.07 |
|
|
