Syngene 539268 full analysis,charts,indicators,moving averages,SMA,DMA,EMA,ADX,MACD,RSISyngene 539268 WideScreen charts, DMA,SMA,EMA technical analysis, forecast prediction, by indicators ADX,MACD,RSI,CCI BSE stock exchange
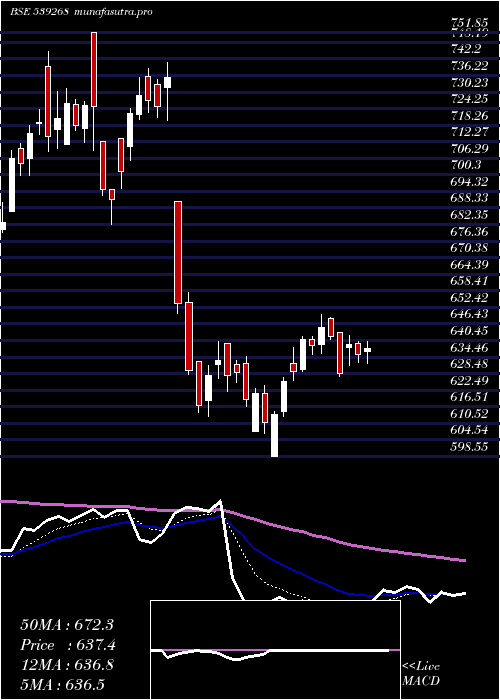
Daily price and charts and targets Syngene Strong Daily Stock price targets for Syngene 539268 are 652.25 and 674.3 | Daily Target 1 | 634.2 | | Daily Target 2 | 648.25 | | Daily Target 3 | 656.25 | | Daily Target 4 | 670.3 | | Daily Target 5 | 678.3 |
Daily price and volume Syngene
| Date |
Closing |
Open |
Range |
Volume |
Thu 23 October 2025 |
662.30 (3.19%) |
644.05 |
642.20 - 664.25 |
0.6378 times |
Tue 21 October 2025 |
641.80 (-0.34%) |
644.00 |
640.20 - 645.85 |
0.121 times |
Mon 20 October 2025 |
644.00 (0.89%) |
636.65 |
636.65 - 646.05 |
0.2927 times |
Fri 17 October 2025 |
638.35 (-0.37%) |
647.65 |
631.95 - 647.65 |
0.6576 times |
Thu 16 October 2025 |
640.75 (2.01%) |
630.00 |
628.20 - 648.20 |
1.8001 times |
Wed 15 October 2025 |
628.15 (0.35%) |
626.00 |
625.20 - 631.30 |
0.8723 times |
Tue 14 October 2025 |
625.95 (-1.23%) |
633.75 |
617.65 - 635.60 |
3.3693 times |
Mon 13 October 2025 |
633.75 (-2.72%) |
641.30 |
631.45 - 649.00 |
0.7329 times |
Fri 10 October 2025 |
651.50 (2.15%) |
632.25 |
631.00 - 656.20 |
0.7929 times |
Thu 09 October 2025 |
637.80 (1.12%) |
628.05 |
628.05 - 643.15 |
0.7234 times |
Wed 08 October 2025 |
630.75 (-0.3%) |
633.55 |
628.00 - 637.00 |
1.455 times |
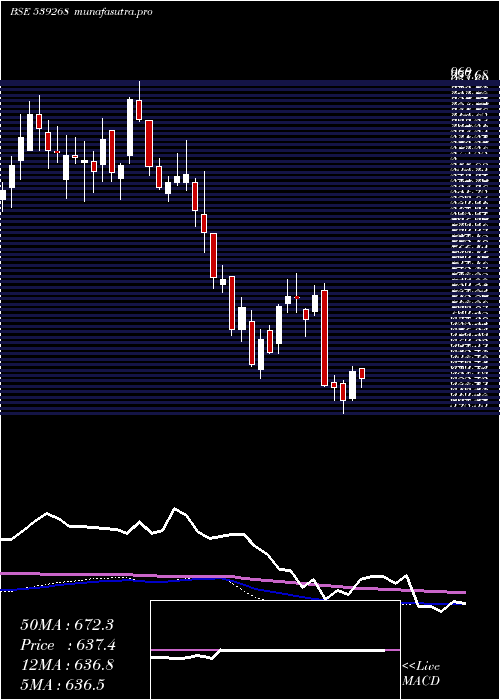
Weekly price and charts Syngene Strong weekly Stock price targets for Syngene 539268 are 649.48 and 677.08 | Weekly Target 1 | 626.8 | | Weekly Target 2 | 644.55 | | Weekly Target 3 | 654.4 | | Weekly Target 4 | 672.15 | | Weekly Target 5 | 682 |
Weekly price and volumes for Syngene
| Date |
Closing |
Open |
Range |
Volume |
Thu 23 October 2025 |
662.30 (3.75%) |
636.65 |
636.65 - 664.25 |
0.1472 times |
Fri 17 October 2025 |
638.35 (-2.02%) |
641.30 |
617.65 - 649.00 |
1.0402 times |
Fri 10 October 2025 |
651.50 (2.51%) |
635.25 |
625.05 - 656.20 |
6.4375 times |
Fri 03 October 2025 |
635.55 (4.21%) |
611.25 |
607.70 - 640.00 |
0.3225 times |
Fri 26 September 2025 |
609.85 (-8.38%) |
666.70 |
608.40 - 668.20 |
0.3292 times |
Fri 19 September 2025 |
665.65 (0.22%) |
655.05 |
649.35 - 673.85 |
0.4843 times |
Fri 12 September 2025 |
664.20 (2.47%) |
657.90 |
627.75 - 666.60 |
0.4396 times |
Fri 05 September 2025 |
648.20 (3.64%) |
624.95 |
624.90 - 665.50 |
0.2603 times |
Fri 29 August 2025 |
625.45 (-6.2%) |
665.45 |
624.50 - 672.20 |
0.2653 times |
Fri 22 August 2025 |
666.80 (-0.16%) |
668.40 |
653.85 - 684.00 |
0.2742 times |
Thu 14 August 2025 |
667.85 (1.92%) |
657.00 |
639.35 - 672.35 |
0.4016 times |
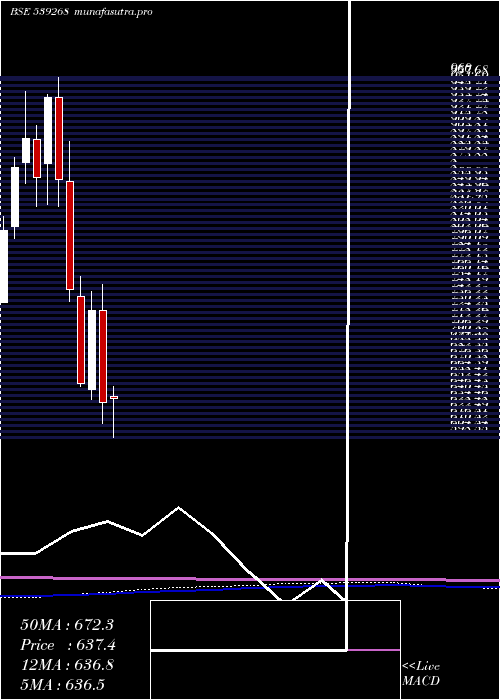
Monthly price and charts Syngene Strong monthly Stock price targets for Syngene 539268 are 639.98 and 686.58 | Monthly Target 1 | 601.47 | | Monthly Target 2 | 631.88 | | Monthly Target 3 | 648.06666666667 | | Monthly Target 4 | 678.48 | | Monthly Target 5 | 694.67 |
Monthly price and volumes Syngene
| Date |
Closing |
Open |
Range |
Volume |
Thu 23 October 2025 |
662.30 (6.23%) |
624.55 |
617.65 - 664.25 |
1.9301 times |
Tue 30 September 2025 |
623.45 (-0.32%) |
624.95 |
607.70 - 673.85 |
0.4206 times |
Fri 29 August 2025 |
625.45 (-12.33%) |
715.30 |
624.50 - 715.30 |
0.3442 times |
Thu 31 July 2025 |
713.40 (11.67%) |
638.25 |
621.15 - 728.40 |
1.2302 times |
Mon 30 June 2025 |
638.85 (-1.18%) |
656.70 |
623.50 - 671.10 |
0.5001 times |
Fri 30 May 2025 |
646.50 (2.12%) |
639.45 |
598.55 - 657.00 |
0.7875 times |
Wed 30 April 2025 |
633.10 (-12.81%) |
725.85 |
612.90 - 751.85 |
1.5425 times |
Fri 28 March 2025 |
726.10 (11.28%) |
646.85 |
636.60 - 744.90 |
0.2476 times |
Fri 28 February 2025 |
652.50 (-12.65%) |
740.00 |
649.80 - 760.50 |
2.5739 times |
Fri 31 January 2025 |
747.00 (-12.94%) |
856.00 |
735.00 - 895.85 |
0.4235 times |
Tue 31 December 2024 |
858.05 (-8.76%) |
940.00 |
830.20 - 960.00 |
10.8809 times |
DMA SMA EMA moving averages of Syngene 539268
DMA (daily moving average) of Syngene 539268
| DMA period | DMA value | | 5 day DMA | 645.44 | | 12 day DMA | 638.98 | | 20 day DMA | 634.79 | | 35 day DMA | 643.61 | | 50 day DMA | 646.73 | | 100 day DMA | 652.75 | | 150 day DMA | 658.43 | | 200 day DMA | 686.73 | EMA (exponential moving average) of Syngene 539268
| EMA period | EMA current | EMA prev | EMA prev2 | | 5 day EMA | 647.24 | 639.71 | 638.67 | | 12 day EMA | 641.52 | 637.74 | 637 | | 20 day EMA | 641.06 | 638.82 | 638.51 | | 35 day EMA | 643.77 | 642.68 | 642.73 | | 50 day EMA | 649.43 | 648.91 | 649.2 |
SMA (simple moving average) of Syngene 539268
| SMA period | SMA current | SMA prev | SMA prev2 | | 5 day SMA | 645.44 | 638.61 | 635.44 | | 12 day SMA | 638.98 | 636.64 | 636.12 | | 20 day SMA | 634.79 | 633.85 | 634.52 | | 35 day SMA | 643.61 | 642.84 | 642.65 | | 50 day SMA | 646.73 | 646.58 | 647.21 | | 100 day SMA | 652.75 | 652.61 | 652.7 | | 150 day SMA | 658.43 | 658.58 | 658.82 | | 200 day SMA | 686.73 | 687.65 | 688.66 |
|
|
