Adanitrans 539254 full analysis,charts,indicators,moving averages,SMA,DMA,EMA,ADX,MACD,RSIAdanitrans 539254 WideScreen charts, DMA,SMA,EMA technical analysis, forecast prediction, by indicators ADX,MACD,RSI,CCI BSE stock exchange
Daily price and charts and targets Adanitrans Strong Daily Stock price targets for Adanitrans 539254 are 943.6 and 964.95 | Daily Target 1 | 926.35 | | Daily Target 2 | 939.5 | | Daily Target 3 | 947.7 | | Daily Target 4 | 960.85 | | Daily Target 5 | 969.05 |
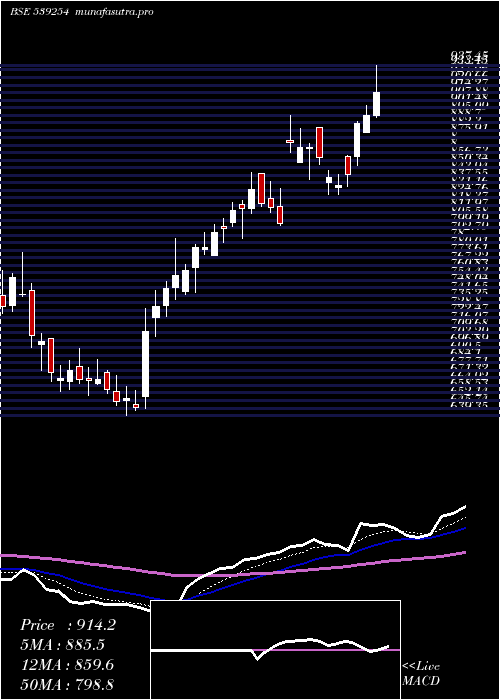
Daily price and volume Adanitrans
| Date |
Closing |
Open |
Range |
Volume |
Thu 23 October 2025 |
952.65 (1.8%) |
934.55 |
934.55 - 955.90 |
0.7714 times |
Tue 21 October 2025 |
935.80 (-0.21%) |
944.70 |
931.00 - 944.70 |
0.3187 times |
Mon 20 October 2025 |
937.80 (0.96%) |
932.00 |
927.10 - 940.00 |
0.3501 times |
Fri 17 October 2025 |
928.90 (-1.92%) |
944.30 |
926.55 - 950.40 |
1.0881 times |
Thu 16 October 2025 |
947.10 (0.19%) |
947.00 |
944.45 - 959.35 |
1.7752 times |
Wed 15 October 2025 |
945.35 (1.29%) |
932.00 |
921.00 - 949.55 |
0.5489 times |
Tue 14 October 2025 |
933.35 (-0.38%) |
936.95 |
919.90 - 941.40 |
0.6469 times |
Mon 13 October 2025 |
936.95 (1.19%) |
922.40 |
921.00 - 942.85 |
2.0975 times |
Fri 10 October 2025 |
925.90 (-0.67%) |
930.90 |
915.00 - 932.10 |
1.0981 times |
Thu 09 October 2025 |
932.15 (2%) |
917.85 |
915.05 - 938.70 |
1.3051 times |
Wed 08 October 2025 |
913.85 (-0.57%) |
922.90 |
908.70 - 925.95 |
1.0577 times |
Weekly price and charts Adanitrans Strong weekly Stock price targets for Adanitrans 539254 are 939.88 and 968.68 | Weekly Target 1 | 916.42 | | Weekly Target 2 | 934.53 | | Weekly Target 3 | 945.21666666667 | | Weekly Target 4 | 963.33 | | Weekly Target 5 | 974.02 |
Weekly price and volumes for Adanitrans
| Date |
Closing |
Open |
Range |
Volume |
Thu 23 October 2025 |
952.65 (2.56%) |
932.00 |
927.10 - 955.90 |
0.1723 times |
Fri 17 October 2025 |
928.90 (0.32%) |
922.40 |
919.90 - 959.35 |
0.7364 times |
Fri 10 October 2025 |
925.90 (1.05%) |
917.00 |
908.70 - 945.00 |
0.5881 times |
Fri 03 October 2025 |
916.30 (4.21%) |
879.25 |
860.15 - 919.90 |
0.4593 times |
Fri 26 September 2025 |
879.25 (0.22%) |
879.05 |
873.70 - 957.95 |
4.7424 times |
Fri 19 September 2025 |
877.30 (5.72%) |
836.20 |
824.80 - 898.95 |
1.5776 times |
Fri 12 September 2025 |
829.80 (9.79%) |
760.00 |
758.00 - 838.00 |
0.5511 times |
Fri 05 September 2025 |
755.80 (-1.03%) |
778.65 |
745.45 - 778.80 |
0.457 times |
Fri 29 August 2025 |
763.70 (-4.47%) |
801.05 |
759.70 - 807.30 |
0.2871 times |
Fri 22 August 2025 |
799.40 (3.11%) |
785.80 |
784.00 - 834.05 |
0.4287 times |
Thu 14 August 2025 |
775.30 (-1.85%) |
789.05 |
774.50 - 800.90 |
6.0533 times |

Monthly price and charts Adanitrans Strong monthly Stock price targets for Adanitrans 539254 are 911.13 and 1000.88 | Monthly Target 1 | 837.45 | | Monthly Target 2 | 895.05 | | Monthly Target 3 | 927.2 | | Monthly Target 4 | 984.8 | | Monthly Target 5 | 1016.95 |
Monthly price and volumes Adanitrans
| Date |
Closing |
Open |
Range |
Volume |
Thu 23 October 2025 |
952.65 (9.3%) |
869.60 |
869.60 - 959.35 |
0.2371 times |
Tue 30 September 2025 |
871.60 (14.13%) |
778.65 |
745.45 - 957.95 |
1.0564 times |
Fri 29 August 2025 |
763.70 (-5.52%) |
812.50 |
759.70 - 834.05 |
3.7796 times |
Thu 31 July 2025 |
808.35 (-8.33%) |
883.05 |
800.05 - 907.60 |
0.4166 times |
Mon 30 June 2025 |
881.80 (1.63%) |
877.75 |
816.80 - 924.15 |
0.685 times |
Fri 30 May 2025 |
867.65 (-3.43%) |
902.75 |
802.20 - 980.55 |
0.7364 times |
Wed 30 April 2025 |
898.50 (3.1%) |
854.70 |
827.25 - 981.95 |
0.6784 times |
Fri 28 March 2025 |
871.50 (33.86%) |
652.20 |
639.35 - 894.50 |
0.9417 times |
Fri 28 February 2025 |
651.05 (-13.55%) |
735.80 |
648.00 - 788.00 |
0.5186 times |
Fri 31 January 2025 |
753.10 (-6.61%) |
808.40 |
682.05 - 832.00 |
0.9502 times |
Tue 31 December 2024 |
806.40 (-4.06%) |
847.00 |
762.25 - 855.00 |
0.8571 times |

DMA SMA EMA moving averages of Adanitrans 539254
DMA (daily moving average) of Adanitrans 539254
| DMA period | DMA value | | 5 day DMA | 940.45 | | 12 day DMA | 934.07 | | 20 day DMA | 917.67 | | 35 day DMA | 878.13 | | 50 day DMA | 852.37 | | 100 day DMA | 854.73 | | 150 day DMA | 857.74 | | 200 day DMA | 830.06 | EMA (exponential moving average) of Adanitrans 539254
| EMA period | EMA current | EMA prev | EMA prev2 | | 5 day EMA | 941.56 | 936.02 | 936.13 | | 12 day EMA | 931.2 | 927.3 | 925.75 | | 20 day EMA | 916.17 | 912.33 | 909.86 | | 35 day EMA | 887.05 | 883.19 | 880.09 | | 50 day EMA | 856.49 | 852.57 | 849.17 |
SMA (simple moving average) of Adanitrans 539254
| SMA period | SMA current | SMA prev | SMA prev2 | | 5 day SMA | 940.45 | 938.99 | 938.5 | | 12 day SMA | 934.07 | 931.89 | 930.26 | | 20 day SMA | 917.67 | 916.29 | 916.4 | | 35 day SMA | 878.13 | 872.72 | 867.89 | | 50 day SMA | 852.37 | 849.11 | 846.29 | | 100 day SMA | 854.73 | 854.02 | 853.35 | | 150 day SMA | 857.74 | 856.27 | 854.77 | | 200 day SMA | 830.06 | 829.15 | 828.34 |
|
|
