Indraind 539175 full analysis,charts,indicators,moving averages,SMA,DMA,EMA,ADX,MACD,RSIIndraind 539175 WideScreen charts, DMA,SMA,EMA technical analysis, forecast prediction, by indicators ADX,MACD,RSI,CCI BSE stock exchange
Daily price and charts and targets Indraind Strong Daily Stock price targets for Indraind 539175 are 3.12 and 3.38 | Daily Target 1 | 3.07 | | Daily Target 2 | 3.17 | | Daily Target 3 | 3.33 | | Daily Target 4 | 3.43 | | Daily Target 5 | 3.59 |
Daily price and volume Indraind
| Date |
Closing |
Open |
Range |
Volume |
Fri 05 December 2025 |
3.27 (-3.54%) |
3.39 |
3.23 - 3.49 |
0.4297 times |
Thu 04 December 2025 |
3.39 (4.95%) |
3.28 |
3.12 - 3.39 |
1.8445 times |
Wed 03 December 2025 |
3.23 (-1.52%) |
3.32 |
3.12 - 3.33 |
1.0955 times |
Tue 02 December 2025 |
3.28 (1.23%) |
3.28 |
3.24 - 3.33 |
1.1168 times |
Mon 01 December 2025 |
3.24 (1.89%) |
3.25 |
3.04 - 3.28 |
1.0014 times |
Fri 28 November 2025 |
3.18 (1.92%) |
3.06 |
3.06 - 3.18 |
2.1448 times |
Thu 27 November 2025 |
3.12 (-1.89%) |
3.24 |
3.12 - 3.24 |
0.9519 times |
Wed 26 November 2025 |
3.18 (-1.85%) |
3.18 |
3.18 - 3.18 |
0.5181 times |
Tue 25 November 2025 |
3.24 (-1.82%) |
3.25 |
3.24 - 3.25 |
0.8384 times |
Mon 24 November 2025 |
3.30 (-1.79%) |
3.30 |
3.30 - 3.30 |
0.059 times |
Fri 21 November 2025 |
3.36 (1.82%) |
3.24 |
3.24 - 3.36 |
2.6625 times |
Weekly price and charts Indraind Strong weekly Stock price targets for Indraind 539175 are 3.16 and 3.61 | Weekly Target 1 | 2.82 | | Weekly Target 2 | 3.04 | | Weekly Target 3 | 3.2666666666667 | | Weekly Target 4 | 3.49 | | Weekly Target 5 | 3.72 |
Weekly price and volumes for Indraind
| Date |
Closing |
Open |
Range |
Volume |
Fri 05 December 2025 |
3.27 (2.83%) |
3.25 |
3.04 - 3.49 |
0.8313 times |
Fri 28 November 2025 |
3.18 (-5.36%) |
3.30 |
3.06 - 3.30 |
0.6835 times |
Fri 21 November 2025 |
3.36 (1.82%) |
3.36 |
3.24 - 3.42 |
1.0386 times |
Fri 14 November 2025 |
3.30 (-5.71%) |
3.43 |
3.19 - 3.43 |
0.8331 times |
Fri 07 November 2025 |
3.50 (7.36%) |
3.32 |
3.32 - 3.50 |
1.7873 times |
Fri 31 October 2025 |
3.26 (11.64%) |
3.02 |
3.02 - 3.26 |
2.115 times |
Thu 23 October 2025 |
2.92 (5.42%) |
2.81 |
2.81 - 2.92 |
0.5903 times |
Fri 17 October 2025 |
2.77 (9.92%) |
2.57 |
2.57 - 2.77 |
0.3107 times |
Fri 10 October 2025 |
2.52 (2.02%) |
2.58 |
2.44 - 2.71 |
1.0385 times |
Fri 03 October 2025 |
2.47 (-0.8%) |
2.37 |
2.15 - 2.48 |
0.7716 times |
Fri 26 September 2025 |
2.49 (14.22%) |
2.08 |
2.08 - 2.75 |
1.8732 times |

Monthly price and charts Indraind Strong monthly Stock price targets for Indraind 539175 are 3.16 and 3.61 | Monthly Target 1 | 2.82 | | Monthly Target 2 | 3.04 | | Monthly Target 3 | 3.2666666666667 | | Monthly Target 4 | 3.49 | | Monthly Target 5 | 3.72 |
Monthly price and volumes Indraind
| Date |
Closing |
Open |
Range |
Volume |
Fri 05 December 2025 |
3.27 (2.83%) |
3.25 |
3.04 - 3.49 |
0.462 times |
Fri 28 November 2025 |
3.18 (-2.45%) |
3.32 |
3.06 - 3.50 |
2.4135 times |
Fri 31 October 2025 |
3.26 (44.25%) |
2.15 |
2.15 - 3.26 |
2.6486 times |
Tue 30 September 2025 |
2.26 (-92.8%) |
30.76 |
2.08 - 30.76 |
3.0108 times |
Fri 29 August 2025 |
31.38 (33.99%) |
23.88 |
23.88 - 33.32 |
0.7051 times |
Thu 31 July 2025 |
23.42 (50.8%) |
15.22 |
15.22 - 23.42 |
0.6417 times |
Mon 30 June 2025 |
15.53 (57.03%) |
9.69 |
9.41 - 15.53 |
0.0685 times |
Fri 30 May 2025 |
9.89 (13.81%) |
9.10 |
8.26 - 11.50 |
0.0261 times |
Wed 30 April 2025 |
8.69 (34.1%) |
6.80 |
6.46 - 10.35 |
0.0136 times |
Fri 28 March 2025 |
6.48 (-18.9%) |
7.98 |
5.92 - 7.98 |
0.0102 times |
Fri 28 February 2025 |
7.99 (27.64%) |
6.71 |
6.55 - 8.19 |
0.0076 times |

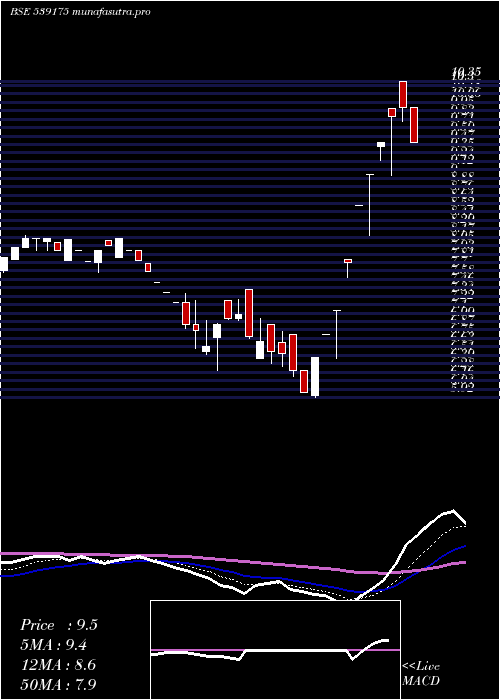
DMA SMA EMA moving averages of Indraind 539175
DMA (daily moving average) of Indraind 539175
| DMA period | DMA value | | 5 day DMA | 3.28 | | 12 day DMA | 3.26 | | 20 day DMA | 3.3 | | 35 day DMA | 3.18 | | 50 day DMA | 2.97 | | 100 day DMA | 10.83 | | 150 day DMA | 11.16 | | 200 day DMA | 10.32 | EMA (exponential moving average) of Indraind 539175
| EMA period | EMA current | EMA prev | EMA prev2 | | 5 day EMA | 3.28 | 3.28 | 3.23 | | 12 day EMA | 3.27 | 3.27 | 3.25 | | 20 day EMA | 3.25 | 3.25 | 3.23 | | 35 day EMA | 3.1 | 3.09 | 3.07 | | 50 day EMA | 2.95 | 2.94 | 2.92 |
SMA (simple moving average) of Indraind 539175
| SMA period | SMA current | SMA prev | SMA prev2 | | 5 day SMA | 3.28 | 3.26 | 3.21 | | 12 day SMA | 3.26 | 3.27 | 3.27 | | 20 day SMA | 3.3 | 3.31 | 3.31 | | 35 day SMA | 3.18 | 3.16 | 3.13 | | 50 day SMA | 2.97 | 2.95 | 2.93 | | 100 day SMA | 10.83 | 10.96 | 11.1 | | 150 day SMA | 11.16 | 11.2 | 11.24 | | 200 day SMA | 10.32 | 10.34 | 10.36 |
|
|
