Mindacorp 538962 full analysis,charts,indicators,moving averages,SMA,DMA,EMA,ADX,MACD,RSIMindacorp 538962 WideScreen charts, DMA,SMA,EMA technical analysis, forecast prediction, by indicators ADX,MACD,RSI,CCI BSE stock exchange
Daily price and charts and targets Mindacorp Strong Daily Stock price targets for Mindacorp 538962 are 502.8 and 509.25 | Daily Target 1 | 501.5 | | Daily Target 2 | 504.1 | | Daily Target 3 | 507.95 | | Daily Target 4 | 510.55 | | Daily Target 5 | 514.4 |
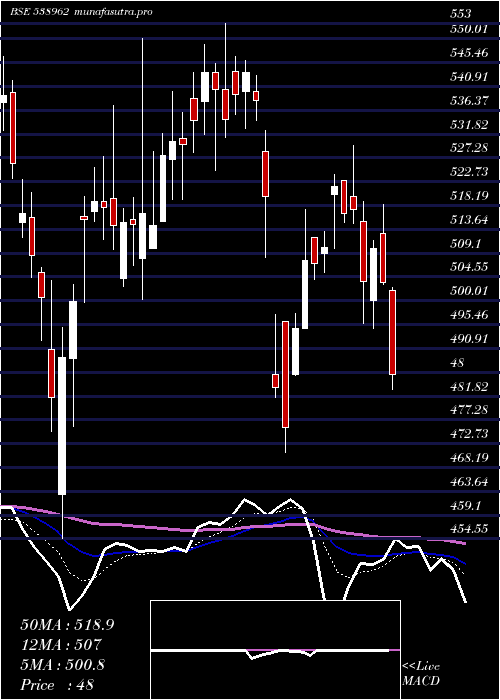
Daily price and volume Mindacorp
| Date |
Closing |
Open |
Range |
Volume |
Wed 03 September 2025 |
506.70 (-0.17%) |
510.20 |
505.35 - 511.80 |
0.4343 times |
Tue 02 September 2025 |
507.55 (0.15%) |
506.80 |
501.00 - 519.00 |
1.6724 times |
Mon 01 September 2025 |
506.80 (1.56%) |
500.00 |
498.50 - 515.60 |
1.4941 times |
Fri 29 August 2025 |
499.00 (-0.44%) |
501.55 |
496.10 - 505.60 |
0.3069 times |
Thu 28 August 2025 |
501.20 (0.28%) |
499.00 |
495.25 - 507.15 |
0.6669 times |
Tue 26 August 2025 |
499.80 (-2.41%) |
510.55 |
496.00 - 511.20 |
0.35 times |
Mon 25 August 2025 |
512.15 (0.88%) |
511.15 |
505.70 - 521.00 |
2.6046 times |
Fri 22 August 2025 |
507.70 (1.52%) |
502.00 |
497.15 - 510.00 |
1.1261 times |
Thu 21 August 2025 |
500.10 (-1.36%) |
511.95 |
498.25 - 511.95 |
0.3591 times |
Wed 20 August 2025 |
507.00 (-1.92%) |
515.45 |
506.15 - 519.20 |
0.9856 times |
Tue 19 August 2025 |
516.95 (1.12%) |
510.05 |
510.05 - 519.15 |
1.6134 times |
Weekly price and charts Mindacorp Strong weekly Stock price targets for Mindacorp 538962 are 502.6 and 523.1 | Weekly Target 1 | 487.57 | | Weekly Target 2 | 497.13 | | Weekly Target 3 | 508.06666666667 | | Weekly Target 4 | 517.63 | | Weekly Target 5 | 528.57 |
Weekly price and volumes for Mindacorp
| Date |
Closing |
Open |
Range |
Volume |
Wed 03 September 2025 |
506.70 (1.54%) |
500.00 |
498.50 - 519.00 |
0.802 times |
Fri 29 August 2025 |
499.00 (-1.71%) |
511.15 |
495.25 - 521.00 |
0.875 times |
Fri 22 August 2025 |
507.70 (2.66%) |
505.20 |
497.15 - 519.20 |
1.1713 times |
Thu 14 August 2025 |
494.55 (8.05%) |
456.05 |
445.25 - 500.65 |
1.3267 times |
Fri 08 August 2025 |
457.70 (-6.71%) |
490.65 |
456.00 - 497.70 |
1.1665 times |
Fri 01 August 2025 |
490.60 (-3.85%) |
506.20 |
483.80 - 517.95 |
0.6126 times |
Fri 25 July 2025 |
510.25 (-3.62%) |
529.05 |
503.75 - 529.65 |
0.6787 times |
Fri 18 July 2025 |
529.40 (5.08%) |
506.45 |
502.15 - 542.00 |
1.105 times |
Fri 11 July 2025 |
503.80 (-3.24%) |
512.05 |
502.00 - 530.25 |
1.074 times |
Fri 04 July 2025 |
520.65 (1.5%) |
512.05 |
511.10 - 529.70 |
1.1882 times |
Fri 27 June 2025 |
512.95 (0.21%) |
504.90 |
498.10 - 519.70 |
0.6643 times |
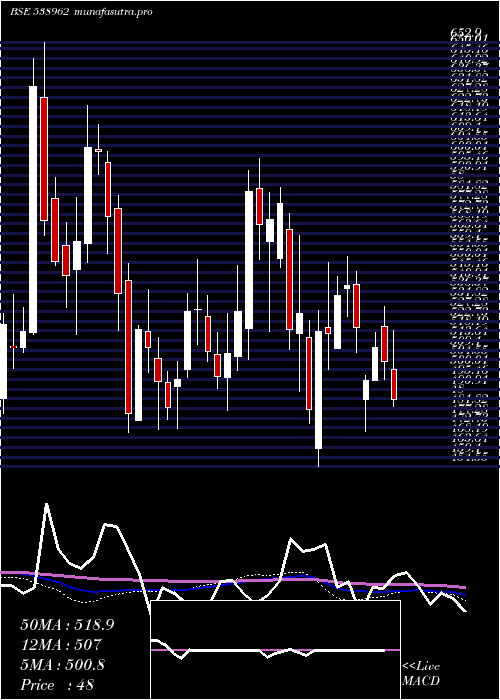
Monthly price and charts Mindacorp Strong monthly Stock price targets for Mindacorp 538962 are 502.6 and 523.1 | Monthly Target 1 | 487.57 | | Monthly Target 2 | 497.13 | | Monthly Target 3 | 508.06666666667 | | Monthly Target 4 | 517.63 | | Monthly Target 5 | 528.57 |
Monthly price and volumes Mindacorp
| Date |
Closing |
Open |
Range |
Volume |
Wed 03 September 2025 |
506.70 (1.54%) |
500.00 |
498.50 - 519.00 |
0.1563 times |
Fri 29 August 2025 |
499.00 (-0.17%) |
495.80 |
445.25 - 521.00 |
0.9259 times |
Thu 31 July 2025 |
499.85 (-4.22%) |
520.10 |
497.00 - 542.00 |
0.8263 times |
Mon 30 June 2025 |
521.90 (-0.11%) |
532.00 |
498.10 - 584.50 |
1.0224 times |
Fri 30 May 2025 |
522.45 (7.5%) |
488.00 |
460.25 - 557.00 |
0.8874 times |
Wed 30 April 2025 |
486.00 (-9.88%) |
540.00 |
471.10 - 545.80 |
0.41 times |
Fri 28 March 2025 |
539.30 (12.02%) |
463.05 |
454.55 - 553.00 |
0.657 times |
Fri 28 February 2025 |
481.45 (-15.56%) |
552.00 |
475.00 - 585.20 |
0.9253 times |
Fri 31 January 2025 |
570.20 (16.39%) |
498.00 |
487.25 - 598.85 |
2.8013 times |
Tue 31 December 2024 |
489.90 (-1.1%) |
500.00 |
481.10 - 551.70 |
1.3881 times |
Fri 29 November 2024 |
495.35 (-3.4%) |
500.40 |
471.95 - 537.40 |
1.0481 times |

DMA SMA EMA moving averages of Mindacorp 538962
DMA (daily moving average) of Mindacorp 538962
| DMA period | DMA value | | 5 day DMA | 504.25 | | 12 day DMA | 506.35 | | 20 day DMA | 493.49 | | 35 day DMA | 501.93 | | 50 day DMA | 506.33 | | 100 day DMA | 510.41 | | 150 day DMA | 519.45 | | 200 day DMA | 517.61 | EMA (exponential moving average) of Mindacorp 538962
| EMA period | EMA current | EMA prev | EMA prev2 | | 5 day EMA | 505.46 | 504.84 | 503.49 | | 12 day EMA | 502.75 | 502.03 | 501.03 | | 20 day EMA | 501.46 | 500.91 | 500.21 | | 35 day EMA | 503.48 | 503.29 | 503.04 | | 50 day EMA | 507.57 | 507.61 | 507.61 |
SMA (simple moving average) of Mindacorp 538962
| SMA period | SMA current | SMA prev | SMA prev2 | | 5 day SMA | 504.25 | 502.87 | 503.79 | | 12 day SMA | 506.35 | 505.33 | 503.96 | | 20 day SMA | 493.49 | 492.95 | 492.11 | | 35 day SMA | 501.93 | 502.2 | 502.09 | | 50 day SMA | 506.33 | 506.28 | 506.37 | | 100 day SMA | 510.41 | 510.73 | 511.09 | | 150 day SMA | 519.45 | 520.01 | 520.41 | | 200 day SMA | 517.61 | 517.61 | 517.66 |
|
|
