Napl 538926 full analysis,charts,indicators,moving averages,SMA,DMA,EMA,ADX,MACD,RSINapl 538926 WideScreen charts, DMA,SMA,EMA technical analysis, forecast prediction, by indicators ADX,MACD,RSI,CCI BSE stock exchange
Daily price and charts and targets Napl Strong Daily Stock price targets for Napl 538926 are 267.13 and 271.38 | Daily Target 1 | 263.58 | | Daily Target 2 | 266.42 | | Daily Target 3 | 267.83333333333 | | Daily Target 4 | 270.67 | | Daily Target 5 | 272.08 |
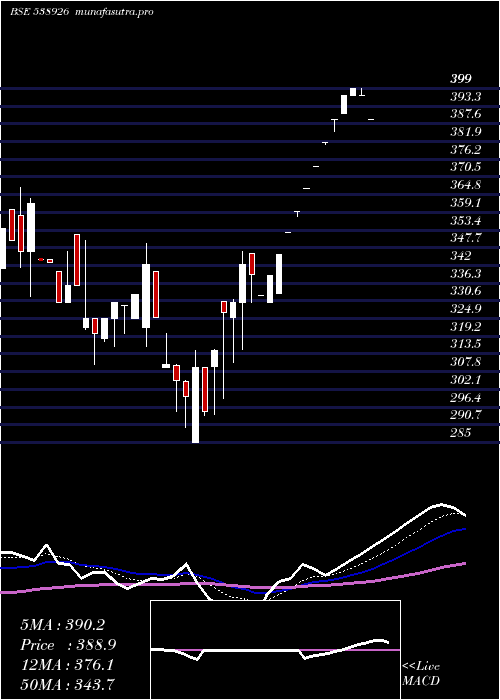
Daily price and volume Napl
| Date |
Closing |
Open |
Range |
Volume |
Fri 05 December 2025 |
269.25 (4.99%) |
269.00 |
265.00 - 269.25 |
3.0705 times |
Thu 04 December 2025 |
256.45 (0.85%) |
266.90 |
254.30 - 266.90 |
0.011 times |
Wed 03 December 2025 |
254.30 (5%) |
242.20 |
230.10 - 254.30 |
1.2621 times |
Tue 02 December 2025 |
242.20 (-4.96%) |
266.60 |
242.15 - 266.60 |
2.0051 times |
Mon 01 December 2025 |
254.85 (-4.91%) |
260.00 |
254.60 - 260.00 |
2.1427 times |
Fri 28 November 2025 |
268.00 (-4.18%) |
291.30 |
265.75 - 291.30 |
0.2465 times |
Thu 27 November 2025 |
279.70 (4.46%) |
267.75 |
254.40 - 279.70 |
0.9675 times |
Wed 26 November 2025 |
267.75 (0%) |
267.75 |
267.75 - 267.75 |
0.022 times |
Tue 25 November 2025 |
267.75 (-4.82%) |
267.75 |
267.75 - 267.75 |
0.2406 times |
Mon 24 November 2025 |
281.30 (-1.66%) |
272.00 |
271.75 - 286.05 |
0.0321 times |
Fri 21 November 2025 |
286.05 (-0.02%) |
286.05 |
286.05 - 286.05 |
0.2972 times |
Weekly price and charts Napl Strong weekly Stock price targets for Napl 538926 are 249.68 and 288.83 | Weekly Target 1 | 217.05 | | Weekly Target 2 | 243.15 | | Weekly Target 3 | 256.2 | | Weekly Target 4 | 282.3 | | Weekly Target 5 | 295.35 |
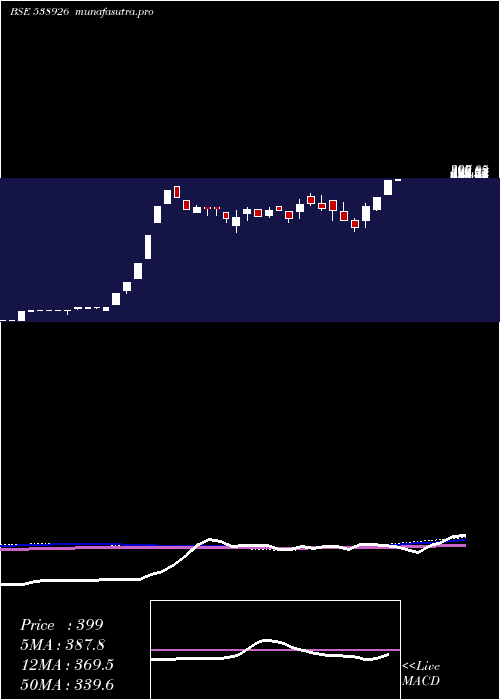
Weekly price and volumes for Napl
| Date |
Closing |
Open |
Range |
Volume |
Fri 05 December 2025 |
269.25 (0.47%) |
260.00 |
230.10 - 269.25 |
0.5347 times |
Fri 28 November 2025 |
268.00 (-6.31%) |
272.00 |
254.40 - 291.30 |
0.095 times |
Fri 21 November 2025 |
286.05 (-2.34%) |
292.80 |
278.30 - 293.70 |
0.2424 times |
Fri 14 November 2025 |
292.90 (4.61%) |
293.00 |
276.00 - 305.00 |
1.8769 times |
Fri 07 November 2025 |
280.00 (0.74%) |
289.70 |
266.00 - 289.70 |
1.1513 times |
Fri 31 October 2025 |
277.95 (0.71%) |
269.90 |
258.00 - 300.90 |
3.4728 times |
Thu 23 October 2025 |
276.00 (-1.5%) |
266.30 |
266.30 - 293.00 |
0.0351 times |
Fri 17 October 2025 |
280.20 (-0.34%) |
294.80 |
261.85 - 301.00 |
0.3693 times |
Fri 10 October 2025 |
281.15 (-2.72%) |
302.65 |
273.00 - 309.70 |
0.0721 times |
Fri 03 October 2025 |
289.00 (-11.89%) |
312.00 |
274.70 - 312.00 |
2.1503 times |
Fri 26 September 2025 |
328.00 (-8.7%) |
350.10 |
314.65 - 360.00 |
2.5817 times |
Monthly price and charts Napl Strong monthly Stock price targets for Napl 538926 are 249.68 and 288.83 | Monthly Target 1 | 217.05 | | Monthly Target 2 | 243.15 | | Monthly Target 3 | 256.2 | | Monthly Target 4 | 282.3 | | Monthly Target 5 | 295.35 |
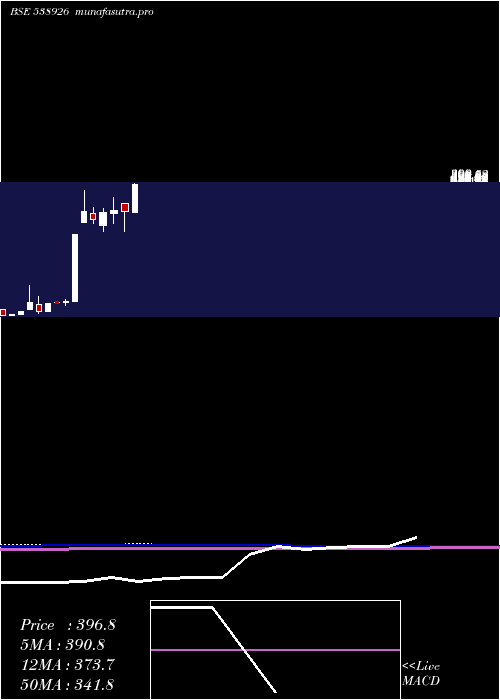
Monthly price and volumes Napl
| Date |
Closing |
Open |
Range |
Volume |
Fri 05 December 2025 |
269.25 (0.47%) |
260.00 |
230.10 - 269.25 |
0.1207 times |
Fri 28 November 2025 |
268.00 (-3.58%) |
289.70 |
254.40 - 305.00 |
0.7598 times |
Fri 31 October 2025 |
277.95 (-6.18%) |
294.80 |
258.00 - 311.05 |
1.12 times |
Tue 30 September 2025 |
296.25 (-14.25%) |
343.80 |
296.05 - 393.80 |
1.7973 times |
Fri 29 August 2025 |
345.50 (-9.79%) |
382.00 |
334.85 - 404.75 |
0.171 times |
Thu 31 July 2025 |
383.00 (15.27%) |
330.00 |
330.00 - 403.90 |
0.5076 times |
Mon 30 June 2025 |
332.25 (-0.97%) |
352.00 |
285.00 - 352.00 |
1.9226 times |
Fri 30 May 2025 |
335.50 (1.48%) |
328.00 |
304.50 - 367.00 |
0.7668 times |
Tue 29 April 2025 |
330.60 (5.45%) |
297.85 |
283.00 - 338.90 |
2.7953 times |
Fri 28 March 2025 |
313.50 (-5.91%) |
326.55 |
303.95 - 343.00 |
0.0389 times |
Fri 28 February 2025 |
333.20 (20.51%) |
304.80 |
304.80 - 382.20 |
0.0284 times |
DMA SMA EMA moving averages of Napl 538926
DMA (daily moving average) of Napl 538926
| DMA period | DMA value | | 5 day DMA | 255.41 | | 12 day DMA | 267.81 | | 20 day DMA | 276.64 | | 35 day DMA | 278.58 | | 50 day DMA | 290 | | 100 day DMA | 331.35 | | 150 day DMA | 331.22 | | 200 day DMA | 327.83 | EMA (exponential moving average) of Napl 538926
| EMA period | EMA current | EMA prev | EMA prev2 | | 5 day EMA | 261.19 | 257.16 | 257.52 | | 12 day EMA | 266.44 | 265.93 | 267.65 | | 20 day EMA | 272.33 | 272.65 | 274.36 | | 35 day EMA | 283.45 | 284.29 | 285.93 | | 50 day EMA | 291.95 | 292.88 | 294.37 |
SMA (simple moving average) of Napl 538926
| SMA period | SMA current | SMA prev | SMA prev2 | | 5 day SMA | 255.41 | 255.16 | 259.81 | | 12 day SMA | 267.81 | 269.61 | 271.76 | | 20 day SMA | 276.64 | 276.61 | 277.73 | | 35 day SMA | 278.58 | 278.92 | 279.74 | | 50 day SMA | 290 | 291.5 | 293.57 | | 100 day SMA | 331.35 | 332.25 | 333.21 | | 150 day SMA | 331.22 | 331.55 | 331.96 | | 200 day SMA | 327.83 | 327.4 | 326.99 |
|
|
