Naysaa 538668 full analysis,charts,indicators,moving averages,SMA,DMA,EMA,ADX,MACD,RSINaysaa 538668 WideScreen charts, DMA,SMA,EMA technical analysis, forecast prediction, by indicators ADX,MACD,RSI,CCI BSE stock exchange
Daily price and charts and targets Naysaa Strong Daily Stock price targets for Naysaa 538668 are 532.3 and 560.15 | Daily Target 1 | 525.92 | | Daily Target 2 | 538.68 | | Daily Target 3 | 553.76666666667 | | Daily Target 4 | 566.53 | | Daily Target 5 | 581.62 |
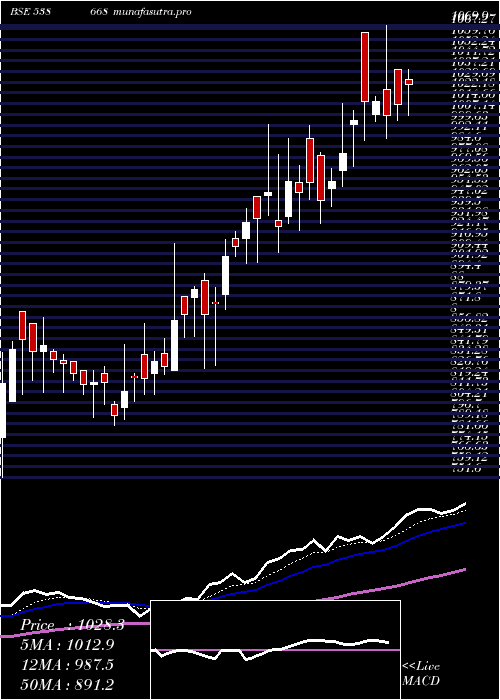
Daily price and volume Naysaa
| Date |
Closing |
Open |
Range |
Volume |
Thu 23 October 2025 |
551.45 (-2.2%) |
563.85 |
541.00 - 568.85 |
0.6693 times |
Tue 21 October 2025 |
563.85 (4.95%) |
551.00 |
540.00 - 574.00 |
0.699 times |
Mon 20 October 2025 |
537.25 (4.37%) |
524.90 |
516.00 - 538.95 |
1 times |
Fri 17 October 2025 |
514.75 (-1.35%) |
521.00 |
511.00 - 532.75 |
0.7961 times |
Thu 16 October 2025 |
521.80 (1.08%) |
525.00 |
509.00 - 540.00 |
1.0006 times |
Wed 15 October 2025 |
516.20 (-0.13%) |
520.95 |
507.00 - 520.95 |
1.0437 times |
Tue 14 October 2025 |
516.85 (-1.3%) |
527.95 |
515.00 - 538.95 |
1.5222 times |
Mon 13 October 2025 |
523.65 (-0.07%) |
515.10 |
515.10 - 534.00 |
1.253 times |
Fri 10 October 2025 |
524.00 (0.33%) |
522.65 |
520.05 - 527.95 |
0.767 times |
Thu 09 October 2025 |
522.30 (-1.15%) |
534.00 |
506.00 - 534.90 |
1.2492 times |
Wed 08 October 2025 |
528.35 (0.57%) |
535.00 |
515.10 - 543.95 |
1.292 times |
Weekly price and charts Naysaa Strong weekly Stock price targets for Naysaa 538668 are 533.73 and 591.73 | Weekly Target 1 | 489.15 | | Weekly Target 2 | 520.3 | | Weekly Target 3 | 547.15 | | Weekly Target 4 | 578.3 | | Weekly Target 5 | 605.15 |
Weekly price and volumes for Naysaa
| Date |
Closing |
Open |
Range |
Volume |
Thu 23 October 2025 |
551.45 (7.13%) |
524.90 |
516.00 - 574.00 |
0.3515 times |
Fri 17 October 2025 |
514.75 (-1.77%) |
515.10 |
507.00 - 540.00 |
0.8335 times |
Fri 10 October 2025 |
524.00 (2.45%) |
506.00 |
470.10 - 543.95 |
1.1485 times |
Fri 03 October 2025 |
511.45 (-3.18%) |
534.95 |
510.00 - 542.85 |
0.4936 times |
Fri 26 September 2025 |
528.25 (-1.34%) |
536.95 |
520.15 - 542.95 |
0.7945 times |
Fri 19 September 2025 |
535.40 (-3.37%) |
548.00 |
527.00 - 569.00 |
0.9377 times |
Fri 12 September 2025 |
554.10 (-1.56%) |
569.00 |
544.00 - 569.00 |
0.9123 times |
Fri 05 September 2025 |
562.90 (-1.84%) |
575.00 |
556.10 - 579.00 |
0.7193 times |
Fri 29 August 2025 |
573.45 (4.13%) |
558.95 |
541.00 - 581.95 |
0.847 times |
Fri 22 August 2025 |
550.70 (-5.1%) |
571.10 |
527.00 - 579.70 |
2.962 times |
Thu 14 August 2025 |
580.30 (1.2%) |
553.40 |
550.10 - 617.95 |
0.7604 times |

Monthly price and charts Naysaa Strong monthly Stock price targets for Naysaa 538668 are 510.78 and 614.68 | Monthly Target 1 | 427.95 | | Monthly Target 2 | 489.7 | | Monthly Target 3 | 531.85 | | Monthly Target 4 | 593.6 | | Monthly Target 5 | 635.75 |
Monthly price and volumes Naysaa
| Date |
Closing |
Open |
Range |
Volume |
Thu 23 October 2025 |
551.45 (5.89%) |
524.95 |
470.10 - 574.00 |
0.6822 times |
Tue 30 September 2025 |
520.80 (-9.18%) |
575.00 |
511.00 - 579.00 |
0.9935 times |
Fri 29 August 2025 |
573.45 (-0.88%) |
583.00 |
527.00 - 617.95 |
1.6018 times |
Thu 31 July 2025 |
578.55 (-48.23%) |
1198.90 |
501.00 - 1198.90 |
1.3288 times |
Mon 30 June 2025 |
1117.55 (9.34%) |
1038.90 |
990.10 - 1164.90 |
1.1939 times |
Fri 30 May 2025 |
1022.10 (11.82%) |
920.00 |
902.00 - 1069.90 |
1.698 times |
Wed 30 April 2025 |
914.05 (10.81%) |
826.90 |
788.00 - 924.70 |
0.4894 times |
Fri 28 March 2025 |
824.90 (0.72%) |
801.00 |
749.15 - 868.70 |
0.6115 times |
Fri 28 February 2025 |
819.00 (11.29%) |
724.45 |
679.50 - 859.55 |
0.5927 times |
Fri 31 January 2025 |
735.90 (4.72%) |
737.00 |
628.30 - 776.55 |
0.8081 times |
Tue 31 December 2024 |
702.75 (3.05%) |
689.50 |
671.05 - 817.35 |
1.0479 times |
DMA SMA EMA moving averages of Naysaa 538668
DMA (daily moving average) of Naysaa 538668
| DMA period | DMA value | | 5 day DMA | 537.82 | | 12 day DMA | 528.82 | | 20 day DMA | 525.3 | | 35 day DMA | 535.75 | | 50 day DMA | 545.66 | | 100 day DMA | 691.58 | | 150 day DMA | 758.16 | | 200 day DMA | 751.89 | EMA (exponential moving average) of Naysaa 538668
| EMA period | EMA current | EMA prev | EMA prev2 | | 5 day EMA | 542.27 | 537.68 | 524.6 | | 12 day EMA | 532.92 | 529.55 | 523.31 | | 20 day EMA | 532.18 | 530.15 | 526.6 | | 35 day EMA | 538.46 | 537.69 | 536.15 | | 50 day EMA | 547.94 | 547.8 | 547.14 |
SMA (simple moving average) of Naysaa 538668
| SMA period | SMA current | SMA prev | SMA prev2 | | 5 day SMA | 537.82 | 530.77 | 521.37 | | 12 day SMA | 528.82 | 524.17 | 519.8 | | 20 day SMA | 525.3 | 524.32 | 522.92 | | 35 day SMA | 535.75 | 536.27 | 536.43 | | 50 day SMA | 545.66 | 546.1 | 546.3 | | 100 day SMA | 691.58 | 695.86 | 700.21 | | 150 day SMA | 758.16 | 759.96 | 761.51 | | 200 day SMA | 751.89 | 752.69 | 753.27 |
|
|
