AnishaImpex 537785 full analysis,charts,indicators,moving averages,SMA,DMA,EMA,ADX,MACD,RSIAnisha Impex 537785 WideScreen charts, DMA,SMA,EMA technical analysis, forecast prediction, by indicators ADX,MACD,RSI,CCI BSE stock exchange
Daily price and charts and targets AnishaImpex Strong Daily Stock price targets for AnishaImpex 537785 are 152.35 and 160.25 | Daily Target 1 | 146.13 | | Daily Target 2 | 150.67 | | Daily Target 3 | 154.03333333333 | | Daily Target 4 | 158.57 | | Daily Target 5 | 161.93 |
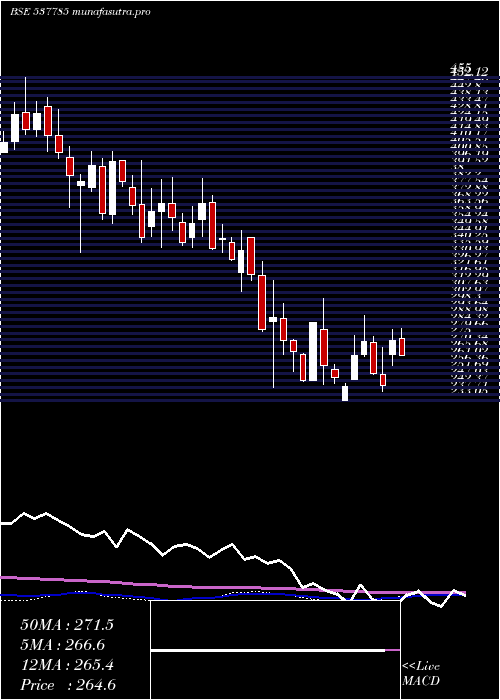
Daily price and volume Anisha Impex
| Date |
Closing |
Open |
Range |
Volume |
Fri 05 December 2025 |
155.20 (3.81%) |
151.00 |
149.50 - 157.40 |
0.2449 times |
Thu 04 December 2025 |
149.50 (-3.45%) |
153.00 |
147.55 - 153.00 |
0.1609 times |
Wed 03 December 2025 |
154.85 (0.98%) |
156.00 |
151.85 - 159.45 |
0.7705 times |
Tue 02 December 2025 |
153.35 (-2.6%) |
157.45 |
153.10 - 159.70 |
0.1341 times |
Mon 01 December 2025 |
157.45 (-3.58%) |
162.95 |
154.80 - 163.60 |
1.187 times |
Fri 28 November 2025 |
163.30 (1.68%) |
162.00 |
160.65 - 163.35 |
0.2503 times |
Thu 27 November 2025 |
160.60 (-0.46%) |
161.35 |
160.50 - 163.00 |
0.2628 times |
Wed 26 November 2025 |
161.35 (3.76%) |
153.00 |
153.00 - 161.35 |
5.4952 times |
Tue 25 November 2025 |
155.50 (0.26%) |
157.60 |
153.50 - 157.60 |
0.6364 times |
Mon 24 November 2025 |
155.10 (-2.18%) |
158.00 |
155.10 - 164.00 |
0.8581 times |
Fri 21 November 2025 |
158.55 (-2.85%) |
163.20 |
158.00 - 175.30 |
1.3854 times |

Weekly price and charts AnishaImpex Strong weekly Stock price targets for AnishaImpex 537785 are 143.35 and 159.4 | Weekly Target 1 | 139.4 | | Weekly Target 2 | 147.3 | | Weekly Target 3 | 155.45 | | Weekly Target 4 | 163.35 | | Weekly Target 5 | 171.5 |
Weekly price and volumes for Anisha Impex
| Date |
Closing |
Open |
Range |
Volume |
Fri 05 December 2025 |
155.20 (-4.96%) |
162.95 |
147.55 - 163.60 |
0.4466 times |
Fri 28 November 2025 |
163.30 (3%) |
158.00 |
153.00 - 164.00 |
1.3417 times |
Fri 21 November 2025 |
158.55 (-11.13%) |
187.90 |
158.00 - 187.90 |
0.8142 times |
Fri 14 November 2025 |
178.40 (-11.77%) |
202.25 |
170.55 - 210.00 |
1.248 times |
Fri 07 November 2025 |
202.20 (-5.65%) |
215.00 |
201.40 - 215.35 |
0.5824 times |
Fri 31 October 2025 |
214.30 (-2.41%) |
222.00 |
213.55 - 222.00 |
0.288 times |
Thu 23 October 2025 |
219.60 (-5.24%) |
239.95 |
203.80 - 239.95 |
0.7554 times |
Fri 17 October 2025 |
231.75 (2.84%) |
226.45 |
218.10 - 238.00 |
1.1831 times |
Fri 10 October 2025 |
225.35 (0.45%) |
224.35 |
209.30 - 228.90 |
1.3813 times |
Fri 03 October 2025 |
224.35 (-1.17%) |
224.70 |
221.00 - 228.00 |
1.9593 times |
Fri 26 September 2025 |
227.00 (-2.66%) |
221.15 |
218.40 - 240.55 |
1.3708 times |
Monthly price and charts AnishaImpex Strong monthly Stock price targets for AnishaImpex 537785 are 143.35 and 159.4 | Monthly Target 1 | 139.4 | | Monthly Target 2 | 147.3 | | Monthly Target 3 | 155.45 | | Monthly Target 4 | 163.35 | | Monthly Target 5 | 171.5 |
Monthly price and volumes Anisha Impex
| Date |
Closing |
Open |
Range |
Volume |
Fri 05 December 2025 |
155.20 (-4.96%) |
162.95 |
147.55 - 163.60 |
0.0607 times |
Fri 28 November 2025 |
163.30 (-23.8%) |
215.00 |
153.00 - 215.35 |
0.5417 times |
Fri 31 October 2025 |
214.30 (-3.71%) |
223.05 |
203.80 - 239.95 |
0.6748 times |
Tue 30 September 2025 |
222.55 (-5.4%) |
235.30 |
218.40 - 258.00 |
1.0982 times |
Fri 29 August 2025 |
235.25 (-2.3%) |
245.65 |
214.20 - 275.00 |
1.7912 times |
Thu 31 July 2025 |
240.80 (-2.98%) |
251.20 |
226.00 - 262.00 |
1.3595 times |
Mon 30 June 2025 |
248.20 (-3.08%) |
257.35 |
240.10 - 276.00 |
0.818 times |
Fri 30 May 2025 |
256.10 (-1.99%) |
259.00 |
239.55 - 283.00 |
0.7026 times |
Wed 30 April 2025 |
261.30 (1.38%) |
255.00 |
233.05 - 292.00 |
0.9708 times |
Fri 28 March 2025 |
257.75 (-6.2%) |
274.80 |
244.70 - 303.45 |
1.9825 times |
Fri 28 February 2025 |
274.80 (-18.36%) |
345.20 |
242.00 - 345.20 |
3.4912 times |

DMA SMA EMA moving averages of Anisha Impex 537785
DMA (daily moving average) of Anisha Impex 537785
| DMA period | DMA value | | 5 day DMA | 154.07 | | 12 day DMA | 157.33 | | 20 day DMA | 168.5 | | 35 day DMA | 190.63 | | 50 day DMA | 200.9 | | 100 day DMA | 218.72 | | 150 day DMA | 231.27 | | 200 day DMA | 243.01 | EMA (exponential moving average) of Anisha Impex 537785
| EMA period | EMA current | EMA prev | EMA prev2 | | 5 day EMA | 154.73 | 154.49 | 156.98 | | 12 day EMA | 160.7 | 161.7 | 163.92 | | 20 day EMA | 169.49 | 170.99 | 173.25 | | 35 day EMA | 183.36 | 185.02 | 187.11 | | 50 day EMA | 198.99 | 200.78 | 202.87 |
SMA (simple moving average) of Anisha Impex 537785
| SMA period | SMA current | SMA prev | SMA prev2 | | 5 day SMA | 154.07 | 155.69 | 157.91 | | 12 day SMA | 157.33 | 158.73 | 161.27 | | 20 day SMA | 168.5 | 171.03 | 174.07 | | 35 day SMA | 190.63 | 192.63 | 194.37 | | 50 day SMA | 200.9 | 202.4 | 204.08 | | 100 day SMA | 218.72 | 219.5 | 220.42 | | 150 day SMA | 231.27 | 232.06 | 232.98 | | 200 day SMA | 243.01 | 243.86 | 244.71 |
|
|
