ChemtechInd 537326 full analysis,charts,indicators,moving averages,SMA,DMA,EMA,ADX,MACD,RSIChemtech Ind 537326 WideScreen charts, DMA,SMA,EMA technical analysis, forecast prediction, by indicators ADX,MACD,RSI,CCI BSE stock exchange
Daily price and charts and targets ChemtechInd Strong Daily Stock price targets for ChemtechInd 537326 are 121.05 and 125.65 | Daily Target 1 | 117.6 | | Daily Target 2 | 119.9 | | Daily Target 3 | 122.2 | | Daily Target 4 | 124.5 | | Daily Target 5 | 126.8 |
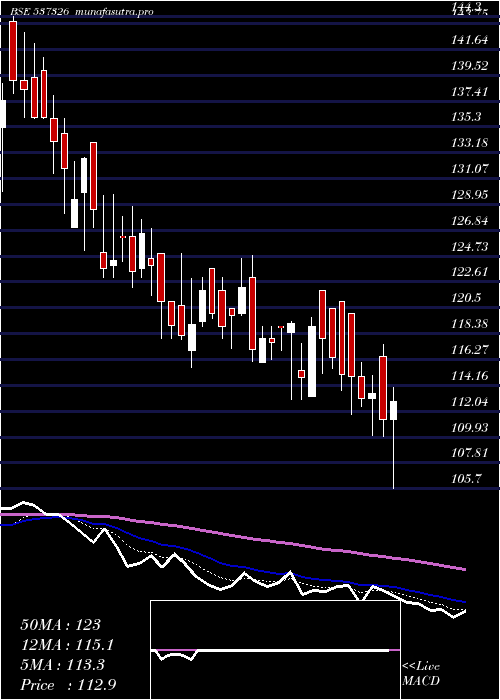
Daily price and volume Chemtech Ind
| Date |
Closing |
Open |
Range |
Volume |
Fri 11 July 2025 |
122.20 (1.96%) |
120.05 |
119.90 - 124.50 |
1.0942 times |
Thu 10 July 2025 |
119.85 (0.71%) |
120.45 |
117.20 - 120.45 |
0.5153 times |
Wed 09 July 2025 |
119.00 (-0.83%) |
121.95 |
118.00 - 123.00 |
1.1285 times |
Tue 08 July 2025 |
120.00 (-1.6%) |
123.70 |
119.65 - 123.70 |
0.4638 times |
Mon 07 July 2025 |
121.95 (2.39%) |
119.40 |
119.00 - 123.00 |
0.7955 times |
Fri 04 July 2025 |
119.10 (0.72%) |
117.00 |
115.60 - 122.90 |
2.4495 times |
Thu 03 July 2025 |
118.25 (-0.67%) |
120.70 |
117.90 - 124.90 |
1.1515 times |
Wed 02 July 2025 |
119.05 (-1.61%) |
121.00 |
118.00 - 121.00 |
0.5565 times |
Tue 01 July 2025 |
121.00 (-2.38%) |
124.90 |
118.00 - 124.90 |
1.4216 times |
Mon 30 June 2025 |
123.95 (-2.05%) |
124.55 |
121.50 - 126.95 |
0.4235 times |
Fri 27 June 2025 |
126.55 (2.51%) |
123.70 |
123.00 - 127.70 |
0.2687 times |
Weekly price and charts ChemtechInd Strong weekly Stock price targets for ChemtechInd 537326 are 119.7 and 127 | Weekly Target 1 | 114 | | Weekly Target 2 | 118.1 | | Weekly Target 3 | 121.3 | | Weekly Target 4 | 125.4 | | Weekly Target 5 | 128.6 |
Weekly price and volumes for Chemtech Ind
| Date |
Closing |
Open |
Range |
Volume |
Fri 11 July 2025 |
122.20 (2.6%) |
119.40 |
117.20 - 124.50 |
0.9652 times |
Fri 04 July 2025 |
119.10 (-5.89%) |
124.55 |
115.60 - 126.95 |
1.4494 times |
Fri 27 June 2025 |
126.55 (-1.52%) |
125.00 |
122.15 - 129.80 |
0.6816 times |
Thu 19 June 2025 |
128.50 (-4.18%) |
134.75 |
125.20 - 136.00 |
0.6395 times |
Fri 13 June 2025 |
134.10 (-2.44%) |
143.95 |
131.50 - 144.30 |
2.4034 times |
Fri 06 June 2025 |
137.45 (-1.93%) |
140.00 |
121.10 - 140.00 |
1.3773 times |
Fri 30 May 2025 |
140.15 (-2.23%) |
149.90 |
128.55 - 149.90 |
0.7394 times |
Fri 23 May 2025 |
143.35 (6.19%) |
135.65 |
131.35 - 146.10 |
1.181 times |
Fri 16 May 2025 |
135.00 (9.49%) |
122.25 |
122.25 - 139.00 |
0.1826 times |
Fri 09 May 2025 |
123.30 (-3.63%) |
127.95 |
115.30 - 129.60 |
0.3807 times |
Fri 02 May 2025 |
127.95 (-7.85%) |
140.00 |
125.65 - 142.00 |
0.3491 times |

Monthly price and charts ChemtechInd Strong monthly Stock price targets for ChemtechInd 537326 are 114.25 and 123.55 | Monthly Target 1 | 111.6 | | Monthly Target 2 | 116.9 | | Monthly Target 3 | 120.9 | | Monthly Target 4 | 126.2 | | Monthly Target 5 | 130.2 |
Monthly price and volumes Chemtech Ind
| Date |
Closing |
Open |
Range |
Volume |
Fri 11 July 2025 |
122.20 (-1.41%) |
124.90 |
115.60 - 124.90 |
0.3821 times |
Mon 30 June 2025 |
123.95 (-11.56%) |
140.00 |
121.10 - 144.30 |
0.8599 times |
Fri 30 May 2025 |
140.15 (5.97%) |
134.00 |
115.30 - 149.90 |
0.429 times |
Wed 30 April 2025 |
132.25 (22.79%) |
110.95 |
109.75 - 148.00 |
0.6415 times |
Fri 28 March 2025 |
107.70 (-2.71%) |
116.20 |
102.30 - 137.80 |
1.494 times |
Fri 28 February 2025 |
110.70 (-37.21%) |
176.35 |
110.30 - 218.00 |
1.0505 times |
Fri 31 January 2025 |
176.30 (-18.36%) |
215.95 |
162.00 - 226.80 |
0.9027 times |
Tue 31 December 2024 |
215.95 (-4.51%) |
226.15 |
210.10 - 257.50 |
0.9144 times |
Fri 29 November 2024 |
226.15 (-8.44%) |
256.70 |
201.60 - 256.70 |
0.8934 times |
Thu 31 October 2024 |
247.00 (-11.36%) |
292.55 |
222.65 - 326.00 |
2.4325 times |
Mon 30 September 2024 |
278.65 (0.36%) |
272.10 |
258.75 - 290.60 |
0.9059 times |

DMA SMA EMA moving averages of Chemtech Ind 537326
DMA (daily moving average) of Chemtech Ind 537326
| DMA period | DMA value | | 5 day DMA | 120.6 | | 12 day DMA | 121.2 | | 20 day DMA | 124.26 | | 35 day DMA | 128.93 | | 50 day DMA | 129.3 | | 100 day DMA | 132.47 | | 150 day DMA | 158.9 | | 200 day DMA | 183.23 | EMA (exponential moving average) of Chemtech Ind 537326
| EMA period | EMA current | EMA prev | EMA prev2 | | 5 day EMA | 120.72 | 119.98 | 120.05 | | 12 day EMA | 121.91 | 121.86 | 122.23 | | 20 day EMA | 123.92 | 124.1 | 124.55 | | 35 day EMA | 126.3 | 126.54 | 126.93 | | 50 day EMA | 129.13 | 129.41 | 129.8 |
SMA (simple moving average) of Chemtech Ind 537326
| SMA period | SMA current | SMA prev | SMA prev2 | | 5 day SMA | 120.6 | 119.98 | 119.66 | | 12 day SMA | 121.2 | 121.53 | 121.91 | | 20 day SMA | 124.26 | 124.96 | 125.77 | | 35 day SMA | 128.93 | 129.42 | 129.78 | | 50 day SMA | 129.3 | 129.5 | 129.89 | | 100 day SMA | 132.47 | 133.27 | 134.01 | | 150 day SMA | 158.9 | 159.63 | 160.3 | | 200 day SMA | 183.23 | 184.01 | 184.78 |
|
|
