BrahmInfra 535693 full analysis,charts,indicators,moving averages,SMA,DMA,EMA,ADX,MACD,RSIBrahm Infra 535693 WideScreen charts, DMA,SMA,EMA technical analysis, forecast prediction, by indicators ADX,MACD,RSI,CCI BSE stock exchange
Daily price and charts and targets BrahmInfra Strong Daily Stock price targets for BrahmInfra 535693 are 109.8 and 117.35 | Daily Target 1 | 103.87 | | Daily Target 2 | 108.18 | | Daily Target 3 | 111.41666666667 | | Daily Target 4 | 115.73 | | Daily Target 5 | 118.97 |
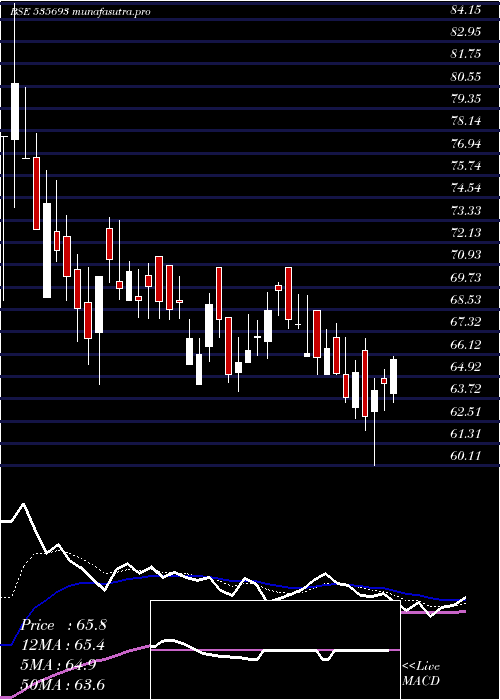
Daily price and volume Brahm Infra
| Date |
Closing |
Open |
Range |
Volume |
Fri 05 December 2025 |
112.50 (7.91%) |
108.80 |
107.10 - 114.65 |
3.0422 times |
Thu 04 December 2025 |
104.25 (3.58%) |
101.00 |
100.00 - 107.75 |
1.113 times |
Wed 03 December 2025 |
100.65 (-3.03%) |
103.05 |
98.05 - 105.50 |
0.9548 times |
Tue 02 December 2025 |
103.80 (-2.4%) |
104.30 |
102.60 - 106.95 |
0.4185 times |
Mon 01 December 2025 |
106.35 (2.09%) |
107.65 |
103.00 - 108.00 |
0.3161 times |
Fri 28 November 2025 |
104.17 (-1.62%) |
109.88 |
102.00 - 109.88 |
0.5724 times |
Thu 27 November 2025 |
105.89 (-2.93%) |
112.59 |
104.50 - 112.59 |
1.2248 times |
Wed 26 November 2025 |
109.09 (3.62%) |
108.45 |
104.05 - 109.95 |
0.4354 times |
Tue 25 November 2025 |
105.28 (0.67%) |
107.00 |
104.00 - 109.80 |
0.817 times |
Mon 24 November 2025 |
104.58 (-2.79%) |
108.00 |
103.00 - 112.00 |
1.1057 times |
Fri 21 November 2025 |
107.58 (-6.25%) |
112.50 |
105.90 - 118.65 |
2.5516 times |
Weekly price and charts BrahmInfra Strong weekly Stock price targets for BrahmInfra 535693 are 105.28 and 121.88 | Weekly Target 1 | 91.8 | | Weekly Target 2 | 102.15 | | Weekly Target 3 | 108.4 | | Weekly Target 4 | 118.75 | | Weekly Target 5 | 125 |
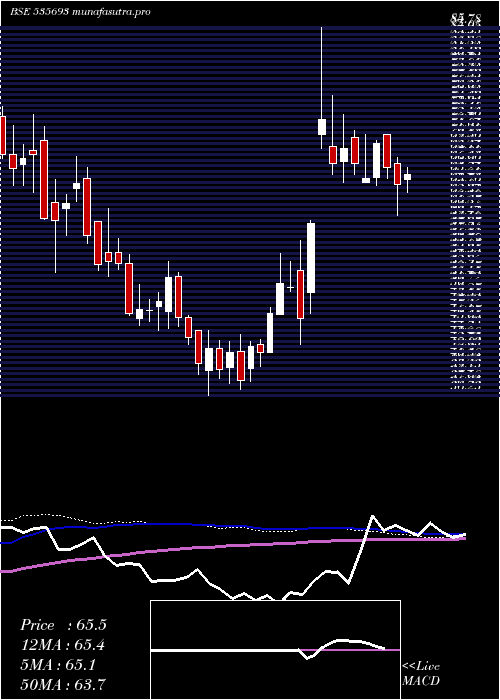
Weekly price and volumes for Brahm Infra
| Date |
Closing |
Open |
Range |
Volume |
Fri 05 December 2025 |
112.50 (8%) |
107.65 |
98.05 - 114.65 |
1.2355 times |
Fri 28 November 2025 |
104.17 (-3.17%) |
108.00 |
102.00 - 112.59 |
0.8784 times |
Fri 21 November 2025 |
107.58 (-6.32%) |
126.00 |
105.90 - 126.32 |
2.4795 times |
Fri 14 November 2025 |
114.84 (8.75%) |
100.00 |
100.00 - 115.52 |
1.8303 times |
Fri 07 November 2025 |
105.60 (8.57%) |
101.00 |
93.61 - 112.95 |
1.4708 times |
Fri 31 October 2025 |
97.26 (9.33%) |
87.06 |
87.06 - 98.64 |
0.8681 times |
Thu 23 October 2025 |
88.96 (-0.07%) |
89.99 |
87.33 - 90.99 |
0.1366 times |
Fri 17 October 2025 |
89.02 (-0.16%) |
89.54 |
88.99 - 94.44 |
0.4435 times |
Fri 10 October 2025 |
89.16 (0.44%) |
92.50 |
86.50 - 92.95 |
0.246 times |
Fri 03 October 2025 |
88.77 (3.21%) |
88.88 |
80.01 - 88.94 |
0.4113 times |
Fri 26 September 2025 |
86.01 (-5.65%) |
91.16 |
85.01 - 91.16 |
0.5222 times |
Monthly price and charts BrahmInfra Strong monthly Stock price targets for BrahmInfra 535693 are 105.28 and 121.88 | Monthly Target 1 | 91.8 | | Monthly Target 2 | 102.15 | | Monthly Target 3 | 108.4 | | Monthly Target 4 | 118.75 | | Monthly Target 5 | 125 |
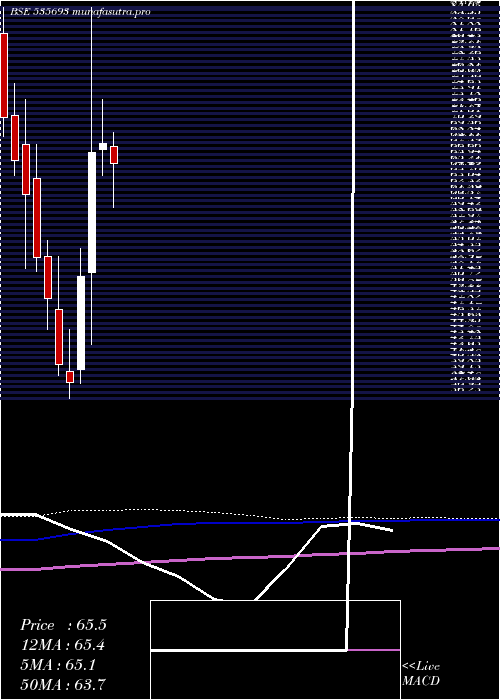
Monthly price and volumes Brahm Infra
| Date |
Closing |
Open |
Range |
Volume |
Fri 05 December 2025 |
112.50 (8%) |
107.65 |
98.05 - 114.65 |
0.2182 times |
Fri 28 November 2025 |
104.17 (7.1%) |
101.00 |
93.61 - 126.32 |
1.1762 times |
Fri 31 October 2025 |
97.26 (18.16%) |
83.47 |
80.01 - 98.64 |
0.3256 times |
Tue 30 September 2025 |
82.31 (-6.55%) |
87.00 |
82.25 - 104.45 |
0.6634 times |
Fri 29 August 2025 |
88.08 (10.39%) |
83.16 |
78.67 - 100.95 |
1.7024 times |
Thu 31 July 2025 |
79.79 (17.34%) |
67.70 |
60.11 - 88.60 |
1.1691 times |
Mon 30 June 2025 |
68.00 (1.57%) |
67.28 |
64.10 - 73.50 |
0.8243 times |
Fri 30 May 2025 |
66.95 (30.1%) |
51.95 |
43.00 - 85.00 |
2.9091 times |
Wed 30 April 2025 |
51.46 (34.64%) |
39.90 |
38.07 - 55.00 |
0.3807 times |
Fri 28 March 2025 |
38.22 (-5.65%) |
39.56 |
36.23 - 44.90 |
0.6309 times |
Fri 28 February 2025 |
40.51 (-16.78%) |
47.33 |
39.11 - 54.00 |
0.3353 times |
DMA SMA EMA moving averages of Brahm Infra 535693
DMA (daily moving average) of Brahm Infra 535693
| DMA period | DMA value | | 5 day DMA | 105.51 | | 12 day DMA | 106.57 | | 20 day DMA | 107.92 | | 35 day DMA | 101.97 | | 50 day DMA | 97.92 | | 100 day DMA | 91.57 | | 150 day DMA | 82.54 | | 200 day DMA | 72.93 | EMA (exponential moving average) of Brahm Infra 535693
| EMA period | EMA current | EMA prev | EMA prev2 | | 5 day EMA | 106.85 | 104.03 | 103.92 | | 12 day EMA | 106.5 | 105.41 | 105.62 | | 20 day EMA | 105.55 | 104.82 | 104.88 | | 35 day EMA | 102.36 | 101.76 | 101.61 | | 50 day EMA | 98.16 | 97.57 | 97.3 |
SMA (simple moving average) of Brahm Infra 535693
| SMA period | SMA current | SMA prev | SMA prev2 | | 5 day SMA | 105.51 | 103.84 | 104.17 | | 12 day SMA | 106.57 | 107.06 | 108.36 | | 20 day SMA | 107.92 | 107.71 | 107.78 | | 35 day SMA | 101.97 | 101.35 | 100.92 | | 50 day SMA | 97.92 | 97.49 | 97.21 | | 100 day SMA | 91.57 | 91.09 | 90.69 | | 150 day SMA | 82.54 | 82.12 | 81.77 | | 200 day SMA | 72.93 | 72.6 | 72.32 |
|
|
